
The narrative of the "K-shaped economy" has become a fixture of modern financial journalism. It is a compelling, intuitive shorthand for our times: a story of a starkly divided society where the ultra-wealthy pull away into the stratosphere while the rest of the population slides into economic precarity. It is a thesis that fits the anxious political mood and generates viral headlines.
The problem with this narrative, however, is that it is fundamentally contradicted by long-term demographic and economic data.
When we analyze decades of U.S. Census Bureau data, the dominant trend of the last half-century is not a downward slide, but a steady upward migration. While the American middle class is indeed shrinking, it is not because households are falling into poverty; it is because millions of them have climbed into higher income brackets. The real economic divide in modern America is not one of income mobility, but of asset ownership—a nuance that popular commentary routinely overlooks.
Main Facts: The Reality of the Shrinking Middle Class
The term "K-shaped economy" originally described a situation where different sectors of an economy diverge, moving in opposite directions simultaneously. One arm of the "K" rises—driven by surging corporate profits, rising asset values, and high-income knowledge work—while the other arm stalls or falls, weighed down by low-wage labor, minimal savings, and small-business failures.

This model accurately described the immediate aftermath of the 2020 pandemic lockdowns. During that crisis, high-skill professionals transitioned seamlessly to remote work, and financial markets surged on the back of unprecedented monetary stimulus. Meanwhile, service-sector workers, hospitality staff, and small businesses faced immediate disruption.
However, applying this short-term "K-shape" model to the broader, five-decade arc of American income distribution misrepresents the structural reality.
U.S. Household Income Distribution Shift (1967 vs. 2022)
=========================================================
Year    Low-Income (<$35k)   Middle-Income ($35k-$100k)   High-Income (>$100k)
---------------------------------------------------------
1967          32.3%                   54.6%                     13.1%
2022          23.3%                   39.1%                     37.5%
=========================================================
*All figures adjusted to constant 2022 dollars.
Source: U.S. Census Bureau
According to U.S. Census data adjusted to constant 2022 dollars:
- The Middle Class has contracted: In 1967, approximately 54.6% of U.S. households were situated in the middle-income bracket, earning between $35,000 and $100,000. By 2022, this share had declined to 39.1%.
- The High-Income bracket has surged: Over the same 55-year period, the proportion of households earning $100,000 or more nearly tripled, climbing from 13.1% to 37.5%.
- The Low-Income bracket has decreased: The segment of the population earning less than $35,000 fell from 32.3% to 23.3%.
These shifts demonstrate that the contraction of the middle class is primarily the result of upward economic mobility. Rather than a population sliding into poverty, the data shows a society where the upper-middle class has become the largest single economic group.

Chronology: The Five-Decade Structural Shift
The transformation of the American economic landscape did not occur overnight. It is the product of long-term structural, educational, and demographic changes that began in the late 1960s.
1. The Post-Industrial Transition (1970s–1980s)
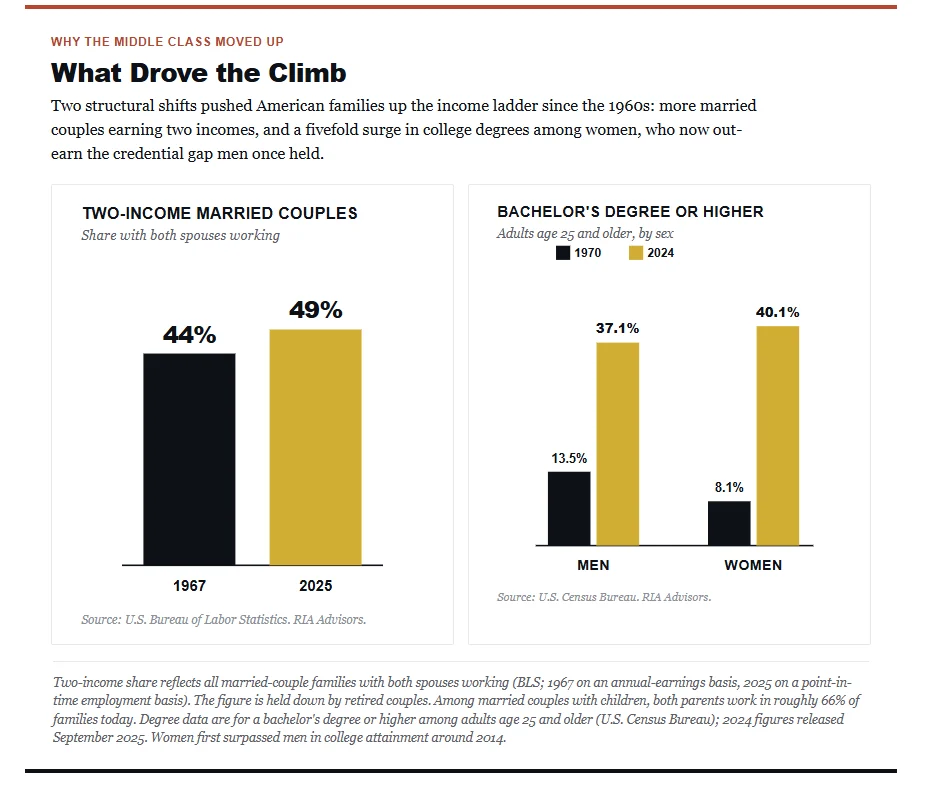
During this period, the U.S. economy began shifting away from a manufacturing-heavy base toward a service- and knowledge-driven economy. While this transition initially sparked anxieties about the loss of stable union jobs, it also coincided with a massive influx of women into the professional workforce.
2. The Educational Revolution and Dual-Income Households (1990s–2000s)
The rise of the knowledge economy placed a premium on higher education. In 1970, only about 11% of American women held a college degree; today, that figure is approximately 40%. As educational attainment rose, so did the prevalence of dual-income households. The combination of two college-educated earners in a single household acted as a powerful engine for upward income mobility, pushing millions of families out of the middle bracket and into the $100,000+ category.
3. The Great Recession and the Era of Low Interest Rates (2008–2019)
The recovery from the 2008 financial crisis introduced a new dynamic. While wage growth remained modest for several years, the Federal Reserve’s policy of near-zero interest rates and quantitative easing inflated asset prices, particularly real estate and equities. This set the stage for a wealth divergence that would define the next decade.

4. The Pandemic Shock and the Present Day (2020–2024)
The brief, sharp recession of 2020 popularized the "K-shaped" terminology. Post-pandemic inflation and subsequent interest rate hikes by the Federal Reserve have further highlighted the difference between those who own appreciating assets and those who rely solely on wages to cover rising living costs.
Supporting Data: Wealth Concentration and the Psychology of "Relative Deprivation"
While income mobility data paints an optimistic picture of the American middle class, the wealth data reveals where the "K-shape" is a reality. The critical distinction lies in the difference between income (the flow of money earned) and wealth (the stock of accumulated assets).
The Asset Ownership Divide
Data from the Federal Reserve’s Distributional Financial Accounts highlights this divergence.
As of the fourth quarter of 2024, the top 10% of households by wealth held approximately 67% of total household net worth, with an average net worth of $8.1 million. In contrast, the bottom 50% of households held just 2.5% of the total wealth, averaging roughly $60,000 per household.

U.S. Wealth Distribution (Q4 2024)
======================================================
Wealth Bracket       Share of Total Net Worth   Average Net Worth
------------------------------------------------------
Top 10%                    67.0%                  $8,100,000
Bottom 50%                  2.5%                     $60,000
======================================================
Source: Federal Reserve Distributional Financial Accounts
This concentration of wealth is largely driven by asset price inflation. Over the past fifteen years, monetary policy, corporate stock buybacks, and housing shortages have driven equities and real estate to historic highs. Those who owned these assets saw their net worth compound. Those who did not own assets—even those with solid professional incomes—found themselves running faster just to stay in place, facing rising rents and higher costs of living without the benefit of compounding investment returns.
The Psychology of "Relative Deprivation"
This asset divide explains a persistent modern paradox: if so many households have moved up the income ladder, why does public sentiment suggest that "everyone feels broke"?
The explanation is largely psychological, rooted in a behavioral finance concept known as relative deprivation. Human financial satisfaction is rarely determined by absolute wealth; instead, it is driven by local, upward comparisons.
According to data from UBS, there are roughly 60 million millionaires globally, a group that holds nearly half of the world’s wealth. In the United States alone, more than 1,000 new millionaires are minted daily. Yet, many of these high earners experience high levels of financial anxiety. By comparing their lifestyle to the top 0.1% or 0.01% rather than the broader global population, they view their economic position through a lens of scarcity.

Official Responses and Expert Perspectives
The debate over the K-shaped economy, wealth inequality, and the future of work has drawn significant analysis from policymakers, research institutions, and investment banks.
On the Shrinking Middle Class
The American Enterprise Institute (AEI) has argued that the "disappearing middle class" narrative is frequently mischaracterized in political discourse. In their policy briefs, AEI researchers emphasize that the upper-middle class has become the nation’s largest and fastest-growing economic demographic, suggesting that public policy should focus more on expanding access to asset ownership rather than trying to preserve outdated industrial-era labor models.
On the Impact of Artificial Intelligence
The rapid advancement of artificial intelligence has introduced a new variable into the economic equation. Goldman Sachs Research has analyzed how AI might reshape the income and wealth distribution over the next decade:
- Job Exposure and Displacement: Goldman Sachs estimates that roughly 300 million jobs globally are exposed to automation via generative AI, representing about one-quarter of current U.S. work hours. However, exposure does not equal elimination. The bank’s baseline projection is that AI will directly displace between 6% and 7% of U.S. jobs over a ten-year period.
- The Middle-Class Threat: Unlike previous waves of automation that targeted manual labor, AI exposure is concentrated in cognitive, administrative, and professional roles—the very sectors that fueled the growth of the upper-middle class over the past thirty years.
- Productivity Gains: On the positive side, Goldman Sachs projects that widespread AI adoption could boost global GDP by 7% and add 1.5 percentage points to annual productivity growth over a decade. Additionally, the infrastructure buildout is projected to create substantial demand, requiring an estimated 500,000 net new workers in the U.S. to support data centers and power grid expansion by 2030.
Implications: Strategic Asset Allocation in a Two-Tiered Economy
For long-term investors, the structural reality of the K-shaped economy—high income mobility alongside highly concentrated asset ownership—provides a clear set of strategic guidelines.

Investment Strategy: Navigating the K-Shape
========================================================================
Economic Arm    Sector Focus               Investment Rationale
------------------------------------------------------------------------
Top Arm         • AI & Semiconductors      • High barriers to entry
(Productive     • Cloud Infrastructure     • Strong intellectual property
 Capital)       • Specialized Biotech      • Pricing power & secular growth
                • Logistics Real Estate    • High margins, low labor exposure
------------------------------------------------------------------------
Bottom Arm      • Defensive Staples        • Steady cash flow, reliable yield
(Caution &      • Utilities & Healthcare   • Insulation from tech disruption
 Selectivity)    • Legacy Retail/Hospitality• Avoid unless tech-enabled
========================================================================
1. Capitalizing on the Top Arm (Productive Capital)
To grow wealth in an environment characterized by asset inflation, investors must focus on ownership of highly productive capital. This includes:
- Secular Tech Infrastructure: Companies at the forefront of the AI, semiconductor, cloud computing, and data infrastructure value chains. These sectors benefit from structural demand that is relatively insulated from traditional consumer economic cycles.
- High-Moat Intellectual Property: Biotech, advanced manufacturing, and specialized business services that rely on proprietary technology and high-skill labor. These businesses possess pricing power, allowing them to pass wage inflation on to customers.
- Growth-Hub Real Estate: Industrial and logistics real estate, data centers, and residential properties in high-growth technology and demographic hubs, rather than legacy commercial office space or traditional retail properties.
2. Navigating the Bottom Arm (Caution and Defensiveness)
Conversely, sectors highly dependent on low-skill, high-turnover labor require a more cautious approach:
- Labor-Intensive, Low-Margin Businesses: Traditional retail, hospitality, and legacy food services face ongoing margin pressure from rising wages and are highly vulnerable to technological disruption.
- The Role of Defensives: While caution is warranted, defensive sectors such as consumer staples, utilities, and healthcare remain essential portfolio components. They provide reliable dividend income and low-beta ballast during periods of market volatility.
3. The Behavioral Imperative: Benchmark to Your Plan
Finally, the psychological data suggests that the greatest threat to individual financial security is often behavioral.
Investors who evaluate their progress by comparing themselves to the ultra-wealthy are prone to making emotional, high-risk decisions—such as chasing speculative assets, over-concentrating portfolios, or abandoning disciplined financial plans. In an economy where wealth is highly visible but unevenly distributed, maintaining focus on personal, absolute financial goals remains the most reliable path to long-term wealth preservation.