
After months of consolidating at high levels, the gold market has suffered a significant technical breakdown, sparking widespread alarm among traders and investors. The primary catalyst for this abrupt downturn was a stronger-than-anticipated U.S. employment report, which reinvigorated the "gold-fearing-Fed" paradigm. As the U.S. dollar surged on the back of rising interest rate expectations, gold futures faced a wave of aggressive liquidation.
However, beneath the surface of this sudden volatility lies a story of market psychology and historical anomalies. While the current sentiment is undeniably bearish, a deeper examination of long-term market data suggests that this summer slump may, in fact, be carving out a major bottom rather than signaling the end of the gold bull market.
The Chronology of a Correction
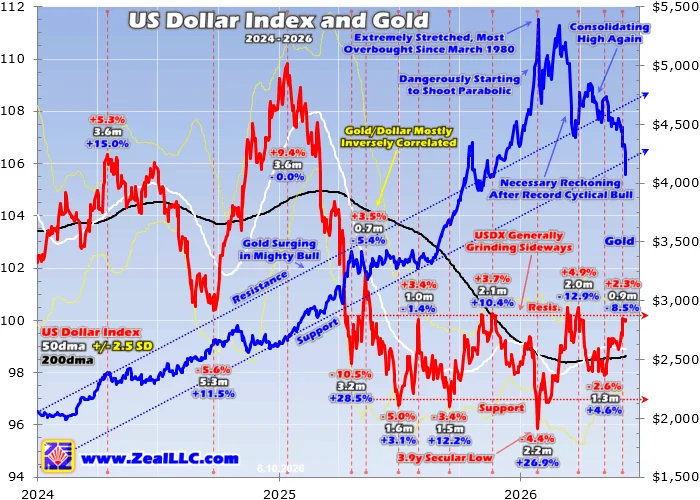
To understand the current volatility, one must look back at the historical context of gold’s recent performance. In late January, gold reached the peak of its largest cyclical bull market in U.S.-dollar terms, having surged an astounding 196.4% over 27.8 months without a single 10% correction.
This speculative mania pushed the metal into uncharted territory, with gold stretching 43.4% above its 200-day moving average—the most overbought state the asset had seen since March 1980. Such an extreme technical position necessitated a reckoning. Following the precedent of the ten largest cyclical bull markets since 1971, gold typically undergoes an average drawdown of 20.8% in just over two months. By late March, gold had plummeted 18.6% in 1.8 months, aligning closely with historical norms.
Following that initial dip, gold entered a period of relative stability, establishing a high-consolidation range with a solid support floor at $4,390. This sideways drift persisted for 2.3 months, reinforcing the technical durability of that support level. Investors, feeling secure in this range, reduced their downside bets. In the week leading up to the fateful "Jobs Friday," speculators’ collective short contracts on gold plunged to an incredible 16.8-year secular low, indicating extreme confidence among market participants.
The Catalyst: A Four-Standard-Deviation Beat
The equilibrium was shattered on the first Friday of June. The nonfarm payrolls report revealed a massive surprise: the economy added 172,000 jobs, more than doubling the consensus forecast of 80,000. This four-standard-deviation beat, compounded by positive revisions to the prior two months of data, triggered an immediate, algorithmic reaction in the markets.
As interest rate hike probabilities shifted upward, the U.S. dollar spiked, and capital flowed rapidly out of gold and stock-index futures. The selling pressure was relentless. While gold could have remained within its consolidation range with a modest 1.9% decline, the momentum proved too fierce. By the close of trading, gold had plummeted 3.7%, shattering its long-held support. The sell-off continued into the following week, with consecutive daily losses extending the total drawdown to 24.5% over 4.3 months.
Market Data and the Fed-Hike Fallacy
The resurgence of the "Fed-hike fear" is, by many accounts, an irrational response to the current economic landscape. The Federal Reserve operates under a dual mandate: stable prices and maximum employment. Historically, strong employment reports imply a more hawkish Fed stance, leading to higher Treasury yields and, by extension, a stronger dollar.
However, the assumption that higher interest rates are fundamentally bearish for gold—a non-yielding asset—is a conventional wisdom that often fails the test of empirical data. A longitudinal analysis of every Fed-rate-hike cycle since 1971 reveals a startlingly different reality.

In the 13 Fed-rate-hike cycles that have occurred over the last 51 years, gold actually rallied during the spans of nine of those cycles. During the eight cycles where gold posted gains, the average return was a robust 49.0%. Even during the most violent hiking cycle in recent history—the 525-basis-point barrage between March 2022 and July 2023—gold managed to finish the period with a modest 3.0% gain, despite suffering a painful mid-cycle correction.
The Myth of the "Rate-Hike Killer"
The current market obsession with potential interest rate hikes ignores two crucial factors: the current starting position of the gold market and the likely trajectory of future Fed policy.
First, gold is no longer in the "crazy-overbought" state of January. As of mid-week, gold had plunged to levels 7.7% below its 200-day moving average, rendering it fundamentally oversold. Second, the likelihood of a massive, 500-basis-point hiking cycle is near zero. With the current federal funds rate already at elevated levels and the Federal Reserve under new leadership—most notably with the appointment of Kevin Warsh—the prospect of aggressive, sustained rate hikes is highly improbable.
Even if the FOMC moves forward with a few token 25-basis-point hikes, history suggests these are insufficient to derail a structural gold bull market. When the Fed hikes are mild, infrequent, and sparse, gold has historically demonstrated a high propensity to thrive.
Implications for Investors: Why the Bearishness is Misplaced
The current "herd" mentality, which has turned decisively bearish following the jobs report, is likely ignoring the "summer doldrums" effect. June is seasonally the weakest month for gold, a period of low volume where outsized selling can disproportionately affect price action. As is often the case in market history, extreme pessimism near a technical support breakdown is the hallmark of a major bottoming process.
Several bullish pillars remain intact:
- Speculative Positioning: With short contracts having reached secular lows before the breakdown, the market is essentially "out of sellers." Conversely, there is significant room for speculators to re-enter long positions once upward momentum returns.
- Portfolio Diversification: Currently, American investors’ allocation to gold stands at roughly one-third of one percent—a figure so small it is effectively zero. This allocation is the result of years of "AI-bubble" euphoria and a focus on high-growth tech stocks. As these bubble-valued markets eventually face a long-overdue correction, the need for safe-haven assets will drive institutional and retail capital into gold.
- Seasonal Rebound: Gold’s historical seasonal patterns suggest that the autumn rally typically begins to gain steam in mid-July. This timing aligns perfectly with the current oversold conditions, providing a catalyst for a potential recovery.
Conclusion
The recent technical breakdown in the gold market is a classic case of market participants reacting to short-term noise while ignoring the deeper, historical reality. While the June jobs report provided a convenient pretext for a sell-off, the move was fundamentally detached from the reality of the Fed’s likely policy path and the inherent resilience of gold during rate-hike cycles.
For the disciplined investor, the current environment presents a compelling entry point. The combination of an oversold technical setup, a shift in seasonal sentiment, and the inevitability of future portfolio rebalancing toward safe-haven assets suggests that the current downturn is a temporary deviation. Far from being the end of the road, this period of heavy liquidation is likely the foundational bedrock for the next leg of gold’s long-term bull market. As the market moves past the "summer doldrums" and the panic of the jobs report fades, the fundamental case for gold will reassert itself, rewarding those who looked past the herd-driven hysteria.