Optimism in the United States is undergoing a strange, bifurcated evolution. While the latest consumer sentiment indices show a modest recovery from their historic lows, the overall mood of the American public remains deeply depressed by historical standards. Under normal economic conditions, such persistent gloom would signal an impending contraction in consumer spending—the primary engine of the U.S. economy. Yet, consumer spending has remained surprisingly resilient.
This paradox highlights a growing structural divide within the American economy. The historical link between how the average citizen feels and how much they spend has broken down, largely due to the disproportionate influence of high-income households. Buoyed by soaring equity markets and rising real estate values, the wealthiest Americans are spending at levels that mask the financial strain felt by the middle and lower classes.
As the Federal Reserve weighs its next monetary policy moves, this "K-shaped" consumer reality, combined with cooling inflation expectations and shifting energy dynamics, presents a complex landscape for policymakers, businesses, and investors alike.
Main Facts: The Great Decoupling of Sentiment and Spending
The latest consumer sentiment data highlights the widening gap between economic perception and spending reality.
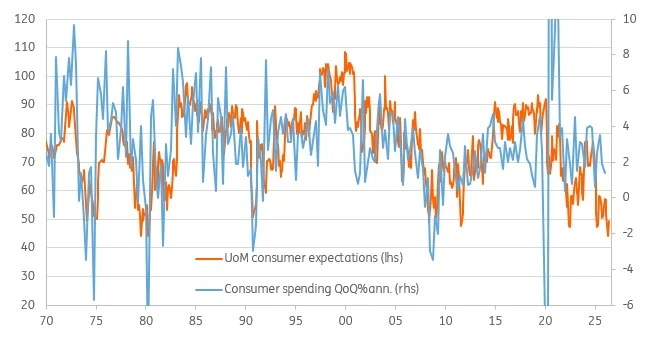
Sentiment Recovers Slightly but Remains Weak: The University of Michigan Consumer Sentiment Index rose to 48.9 from a previous reading of 44.8, beating the market consensus of 46.0. Despite this uptick, the index remains near levels historically associated with economic recessions.
The Breakdown of the Sentiment-Spending Relationship: Historically, a sentiment reading of 48.9 correlates with an approximate 1.5% year-on-year decline in consumer spending. Instead, real consumer spending has continued to expand, driven by a wealthy minority whose financial behavior is decoupled from the sentiment of the median household.
The Spending Skew: Data from the Bureau of Labor Statistics (BLS) indicates that the top 20% of households by income (earning $155,000 or more annually in 2024 terms) account for more than 40% of all consumer spending. Independent analysis from Moody’s Analytics suggests an even more extreme concentration, estimating that this top quintile is responsible for more than 60% of total U.S. consumer spending.
The Wealth Gap Amplifies the Divide: The bottom 60% of American households hold just 15% of the nation’s wealth, making them highly sensitive to inflation and rising borrowing costs. Conversely, the top 20% of households control 70% of the wealth, leaving them well-positioned to benefit from surging property and stock markets.
Rising Job Anxieties: The University of Michigan survey revealed that a net 54% of respondents expect unemployment to rise over the next 12 months. This level of job insecurity matches anxiety levels seen during the 2008 Global Financial Crisis and the recession of the early 1990s.
Easing Inflation Expectations: In a positive development for monetary policymakers, one-year-ahead inflation expectations fell to 4.6% (down from 4.8%, and below the consensus of 4.9%). Long-term (5-to-10-year) inflation expectations also dropped significantly, from 3.9% to 3.4%.
Chronology: How the K-Shaped Economy Formed
To understand the current divergence between consumer sentiment and actual spending, it is necessary to trace the macroeconomic shifts of the post-pandemic era.
Phase 1: The Post-Pandemic Stimulus and Asset Surge (2020–2021)
During the immediate aftermath of the COVID-19 pandemic, unprecedented federal fiscal stimulus and ultra-loose monetary policy flooded the U.S. economy with liquidity. This fueled a rapid appreciation in asset prices, including residential real estate and global equities. Households across the income spectrum accumulated significant excess savings. However, high-income households, who already held the majority of financial assets, saw their net worth expand dramatically.
Phase 2: The Inflation Shock and Fed Tightening (2022–2023)
As supply chain disruptions and surging demand pushed inflation to a 40-year high, the Federal Reserve embarked on one of its most aggressive monetary tightening campaigns in history, raising the federal funds rate from near-zero to over 5%. While high interest rates succeeded in cooling parts of the economy, they also created a sharp divergence:
Lower- and middle-income households quickly depleted their pandemic-era savings. They faced higher costs for necessities like food, rent, and gasoline, alongside skyrocketing credit card and auto loan rates.
High-income households remained insulated. Many had locked in low, long-term fixed-rate mortgages prior to 2022, shielding them from rising borrowing costs. Meanwhile, their investment portfolios and property values continued to benefit from a resilient stock market and a supply-constrained housing market.
Phase 3: The Erosion of Real Income and the Rise of Job Fears (Mid-2023 to Present)
By late 2023 and early 2024, the financial pressure on the average American became more acute. Real household disposable income fell for three consecutive months, directly impacting the median consumer’s purchasing power.
At the same time, high-profile corporate layoffs and a cooling labor market began to fuel widespread employment anxiety. This culminated in the latest University of Michigan survey, where over half of respondents expressed fears of rising unemployment—a sentiment not seen since major economic crises.
Supporting Data: Visualizing the Wealth and Spending Disparity
The structural imbalances driving today’s consumer behavior are clearly reflected in wealth distribution, spending patterns, and shifting inflation expectations.
Table 1: Concentration of Wealth and Spending in the United States
Income Bracket
Share of Total Population
Share of National Wealth
Estimated Share of Consumer Spending (BLS)
Estimated Share of Consumer Spending (Moody’s)
Top 20% (Income $ge$ $155k)
20%
70%
~40% to 45%
~60%+
Middle & Lower Tiers (Bottom 60%)
60%
15%
~35% to 40%
~20% to 25%
This concentration of spending power explains why retail sales and personal consumption expenditures (PCE) remain resilient even when national sentiment surveys suggest widespread economic distress. The top 20% of earners possess enough discretionary spending capacity to single-handedly sustain aggregate economic growth, even as the bottom 60% pull back on non-essential purchases.
Table 2: Shift in Key Consumer Indicators (University of Michigan Survey)
Indicator
Previous Reading
Latest Reading
Market Consensus
Historical Context / Comparison
Consumer Sentiment Index
44.8
48.9
46.0
Remains near historic recessionary lows
1-Year Inflation Expectations
4.8%
4.6%
4.9%
Easing pressure, positive for the Fed
5-10 Year Inflation Expectations
3.9%
3.4%
N/A
Approaching the Fed’s target range
Expect Rising Unemployment
N/A
54.0% (Net)
N/A
Comparable to the 2008 GFC & 1990s Recession
The Energy Factor: Relieving Pressure at the Pump
A key driver of both short-term consumer sentiment and inflation expectations is the price of retail gasoline. Due to positive geopolitical developments—specifically progress toward securing and reopening the Strait of Hormuz—global oil benchmarks have eased.
Recent High: Retail gasoline prices peaked near $4.60 per gallon in several parts of the country.
Near-Term Projection: Analysts forecast gasoline prices will drop below $3.90 to $4.00 per gallon in the coming weeks.
Impact: Because gasoline prices are highly visible, this decline is expected to further anchor consumer inflation expectations and provide modest relief to the median household budget.
Official Responses and Expert Perspectives
The divergence in consumer fortunes has sparked debate among central bankers, economic analysts, and financial institutions regarding the path of monetary policy.
The Federal Reserve’s Balancing Act
Federal Reserve policymakers have acknowledged the uneven nature of the economic recovery. In recent public statements, Fed officials have noted that while aggregate consumer spending remains robust, credit card delinquencies and auto loan defaults are rising among lower-income brackets.
The significant drop in long-term inflation expectations (from 3.9% to 3.4%) in the University of Michigan survey is a welcome development for the Federal Open Market Committee (FOMC). It suggests that despite a prolonged period of high inflation, long-term inflation expectations remain well-anchored. Consequently, major financial institutions, including ING’s economic research team, widely expect the Federal Reserve to hold interest rates steady at its upcoming meeting, effectively ending its monetary tightening cycle.
Analyst Commentary: The "K-Shaped" Reality
Many economists warn that relying on high-income spenders to carry the economy carries inherent risks.
In a recent research note, ING analysts observed:
"Consumer sentiment reflects the median American, who is finding the current economic situation much more challenging due to weak income growth and high prices. However, aggregate spending is driven by higher-income households who are buoyed by massive wealth gains from stocks and real estate. This K-shaped dynamic makes it difficult for traditional sentiment models to accurately predict overall economic momentum."
Moody’s Analytics echoed this sentiment, pointing out that the extreme concentration of spending among the top income earners leaves the retail sector vulnerable to asset market shocks. If the stock market or housing market experiences a sharp correction, the wealthy may quickly reduce their discretionary spending, removing the primary pillar currently supporting U.S. economic growth.
Implications: What This Means for the U.S. Economy
The widening gap between high-income wealth and median-income struggle has significant implications for monetary policy, corporate strategy, and the broader trajectory of the U.S. economy.
1. Monetary Policy: A Soft Landing or Over-Tightening?
The cooling of short- and long-term inflation expectations, combined with declining retail gasoline prices, gives the Federal Reserve the flexibility to pause its interest rate hikes. With job security fears rising to levels consistent with past recessions, further rate increases could risk pushing an already vulnerable median consumer into deeper financial distress. A prolonged pause will allow the lag effects of previous rate hikes to filter through the economy without causing unnecessary damage to the labor market.
2. Corporate Strategy: Target the Top or Value the Bottom?
Businesses are adjusting their strategies to align with this K-shaped consumer landscape.
Luxury and High-End Retail: Brands catering to high-income consumers continue to see strong demand. These companies can maintain pricing power because their target demographic remains insulated from inflation.
Mass Market and Discount Retail: Retailers catering to middle- and lower-income cohorts must focus heavily on value, promotions, and affordable options. Major discount chains and consumer packaged goods companies are already reporting that shoppers are trade-down to private-label brands and pulling back on discretionary items.
An economy that relies on the top 20% of households to generate over 60% of consumer spending is structurally fragile. This spending is highly dependent on the "wealth effect"—the psychological and financial boost that comes from seeing investment portfolios and home values rise.
Should a geopolitical shock, corporate earnings disappointment, or credit crunch trigger a sharp downturn in financial markets, high-income consumers may pull back on spending. Without the financial buffer of the bottom 60%, who are already constrained by falling real incomes and high debt service costs, the U.S. economy could transition rapidly from a period of resilient growth to a sudden contraction.
Ultimately, while the modest improvement in consumer sentiment to 48.9 offers some reassurance, it masks a deeply divided economy. The resilience of the American consumer is real, but it is concentrated in the hands of a wealthy minority. For the median household, the daily reality remains a challenging mix of high prices, stagnant real wages, and growing anxiety over job security.