
Global financial markets have entered a delicate relief phase, characterized by a transition from geopolitical panic to cautious optimism. This shift is driven by a dual catalyst: tentative diplomatic progress between the United States and Iran, which could reopen the critical Strait of Hormuz, and a landmark test of equity market liquidity spearheaded by SpaceX’s record-breaking $75 billion initial public offering (IPO).
While equity benchmarks have edged higher and sovereign bonds have found temporary stability, market participants remain highly vigilant. The prevailing consensus across trading desks is that while the immediate "war premium" is deflating, structural challenges—including a surge in paper supply, tightening leverage on technology shares, and sticky underlying inflation—prevent a full-scale victory lap.
Main Facts
The current market landscape is defined by several interconnected developments across geopolitical, macroeconomic, and corporate spheres:
- Geopolitical Thaw and Oil Slump: The primary driver of the broad-market relief is a draft memorandum of understanding (MOU) between the United States and Iran. The proposed 14-point framework reportedly includes the reopening of the Strait of Hormuz, the lifting of key oil sanctions, the release of frozen funds, and the initiation of a 60-day negotiating window regarding nuclear issues. This prospect has dragged crude prices sharply lower, with Brent crude falling nearly 4% and West Texas Intermediate (WTI) breaking below critical technical support levels.
- The SpaceX Liquidity Test: Space Exploration Technologies Corp. (SpaceX) has completed a historic $75 billion capital raise, representing a massive test of the market’s capacity to absorb primary equity issuance. While shadow markets imply a debut pop of up to 35%, the sheer size of the offering comes at a critical juncture: net US equity supply has turned positive for the first time since 2021, threatening to drain secondary-market liquidity.
- Tech Leverage Curbs: Amidst a powerful rebound in global semiconductor and artificial intelligence (AI) shares, major global investment banks—including Citigroup, JPMorgan Chase, and Goldman Sachs—have begun curbing the leverage extended to hedge funds targeting premier Asian chipmakers such as Samsung Electronics and SK Hynix. This institutional risk management highlights growing concerns over crowded trades and potential valuation pullbacks.
- Monetary and Macro Divergence: The European Central Bank (ECB) has delivered a hawkish rate hike, lifting its deposit rate to 2.25%, while US macroeconomic data presents a conflicting picture of hot Producer Price Index (PPI) figures alongside rising initial jobless claims. Consequently, central banks remain highly sensitive to any potential reversal in energy costs.
Chronology of Events
The market’s transition from geopolitical distress to tentative stabilization unfolded across global trading sessions, establishing a distinct sequence of risk-on rotations.
1. The Asian Rebound and Short-Covering Surge
The relief rally was initiated during the Asian trading session, where regional benchmarks surged on the back of easing Middle Eastern tensions and aggressive short-covering. The MSCI Asia Pacific Index climbed by as much as 3.5%.
South Korea’s Kospi led the advance, skyrocketing by up to 8.6% intraday before consolidating to close 4.6% higher. This move was heavily supported by heavyweights Samsung Electronics and SK Hynix. Concurrently, Japan’s Nikkei index surged at the opening bell, briefly testing the psychologically important 67,000 level, while Chinese and Hong Kong indices joined the broad upward trajectory.
2. European Cyclical Rotation
As European markets opened, investors executed a classic "de-escalation" playbook. The Stoxx 600 index rose sharply, led by cyclical sectors, airlines, travel operators, and UK homebuilders—all of which benefit directly from lower fuel costs and falling mortgage-linked swap rates. Conversely, the traditional "war winners"—primarily energy and defense equities—faced immediate selling pressure as the geopolitical risk premium began to unwind.
3. The New York Open and the Draft MOU Disclosure
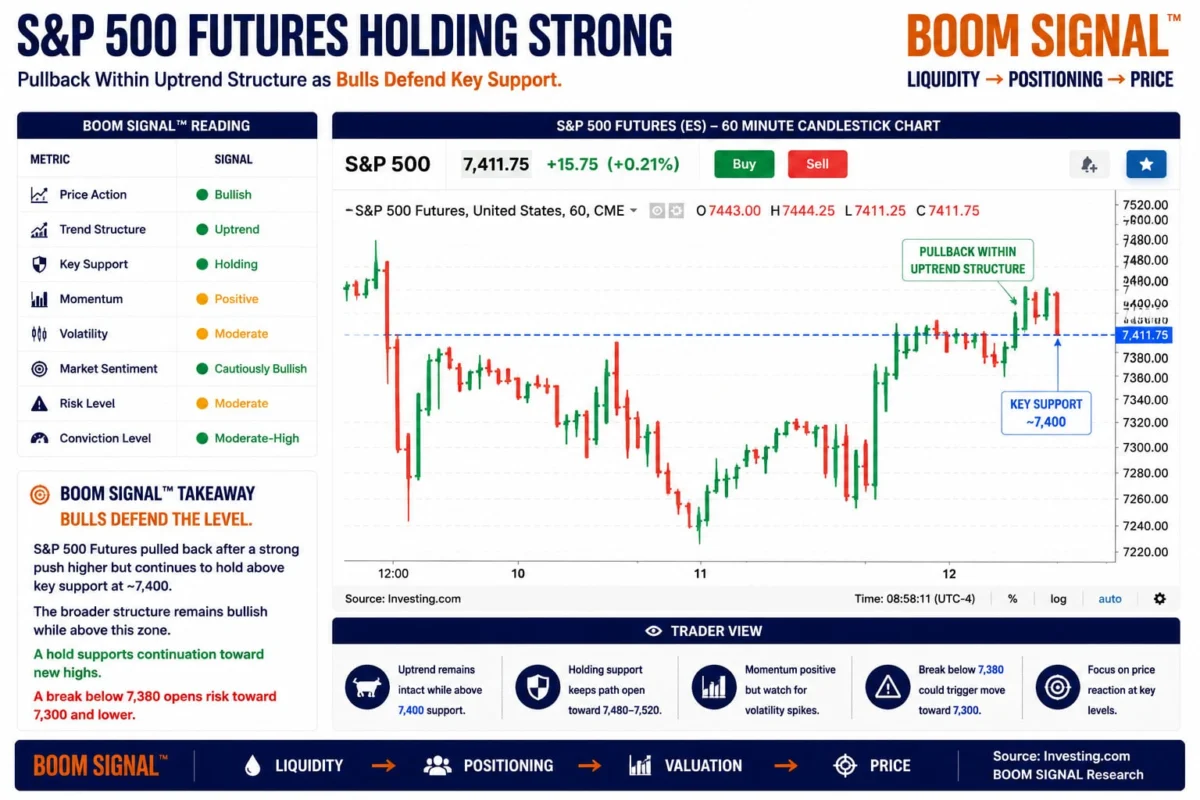
By the start of the New York session, US stock futures pointed to a moderately higher open, with S&P 500 futures up approximately 0.21% following a robust 1.8% gain in the previous session. The "Magnificent Seven" technology complex traded broadly in the green, led by Apple and Nvidia.

The market’s momentum solidified as details of the 14-point US-Iran draft agreement circulated. Statements from US officials suggesting a potential signing as early as the upcoming weekend triggered immediate liquidations in long oil positions, forcing Brent and WTI crude to break key technical support zones.
Supporting Data
A granular examination of market metrics reveals the extent of the asset-class rotation and the underlying liquidity dynamics currently at play.
Energy and Commodities
- WTI Crude: Broke key support levels between $84.46 and $85.95, trading down toward the $83.81 mark.
- Brent Crude: Declined by nearly 4%, marking its first projected close below the $88-per-barrel threshold since the initial stages of the Middle East conflict.
- Gold: Experienced its fourth consecutive week of capital outflows, losing $2.3 billion as safe-haven demand diminished in favor of yield-bearing assets.
Sovereign Debt and Currencies
- US 10-Year Treasury Yield: Hovered near 4.46%. Analysts note that while yields remain well above their pre-conflict level of sub-4.00%, a verified reopening of the Strait of Hormuz could pull the benchmark yield down toward 4.33% and eventually 4.25%.
- US Dollar Index (DXY): Slipped toward 99.64, losing its geopolitical crisis bid but remaining range-bound as currency traders await finalized diplomatic signatures.
Asset Class Yields & Key Levels:
+------------------------+----------------+
| Asset Metric           | Current Value  |
+------------------------+----------------+
| US 10-Year Treasury    | 4.46%          |
| US Dollar Index (DXY)  | 99.64          |
| WTI Crude Oil          | $83.81         |
| Brent Crude Oil        | < $88.00       |
+------------------------+----------------+
Capital Flows and Issuance Dynamics
According to fund-flow data compiled by Bank of America and EPFR:
- Equities: Global equity inflows reached $31.5 billion, marking the 11th consecutive week of positive inflows into US equity funds—the longest such streak since December.
- Bonds: Debt instruments attracted $20.8 billion, representing the 59th consecutive week of inflows.
- Cash and Crypto: Cash reserves saw outflows of $2.5 billion, while cryptocurrency funds experienced a modest reduction of $0.7 billion.
- IPO Historical Performance: Bloomberg data tracking 66 major US tech IPOs and direct listings since 2012 reveals that 86% of pure IPOs closed above their offer price on Day 1, yielding a median first-day gain of 36%.
Global Fund Flows (Weekly Change):
+-------------------+--------------------+
| Asset Class       | Net Flow ($ USD)   |
+-------------------+--------------------+
| Equities          | +$31.5 Billion     |
| Bonds             | +$20.8 Billion     |
| Cash              | -$2.5 Billion      |
| Gold              | -$2.3 Billion      |
| Cryptocurrencies  | -$0.7 Billion      |
+-------------------+--------------------+
Official Responses and Institutional Actions
The shifting geopolitical and corporate landscape has drawn critical commentary and strategic adjustments from political figures, central bankers, and Wall Street institutions.
Geopolitical Declarations
The political leadership of both the United States and Iran has offered contrasting narratives regarding the progress of the MOU:
- United States: President Donald Trump expressed strong optimism, declaring that a bilateral agreement is highly close to completion. He asserted that under the proposed terms, Iran would be permanently barred from acquiring a nuclear weapon, and the Strait of Hormuz could be reopened almost immediately upon signing. Notably, Trump confirmed that a deal regarding Kharg Island—a vital Gulf export hub—is currently excluded from the active negotiations.
- Iran: Iranian state-affiliated media confirmed that the 14-point framework is nearly finalized. However, senior Iranian officials have publicly tempered the market’s enthusiasm, characterizing Western reports concerning specific signing dates and venues as speculative. They emphasized that while draft texts are advanced, Tehran has not yet reached a final, binding conclusion.
Central Bank Policy
In Europe, monetary policymakers have maintained a highly vigilant stance:
- European Central Bank: ECB President Christine Lagarde defended the central bank’s decision to implement its first rate hike since 2023, raising the deposit rate to 2.25%. Lagarde described the policy tightening as "completely warranted and justified." She warned that all policy options remain open, hinting that another rate hike could be executed as early as July should energy-driven inflation pressures resurface.
Wall Street Risk Management
In response to the rapid rise in AI and semiconductor valuations, prime brokerage divisions at major investment banks have taken pre-emptive action:
- Leverage Restrictions: Risk management teams at Citigroup, JPMorgan Chase, and Goldman Sachs have reportedly instituted caps on the leverage extended to hedge funds trading premier Asian tech companies. This coordinated tightening is designed to mitigate systemic risks associated with a sudden pullback in highly concentrated, momentum-driven technology portfolios.
Implications and Market Outlook
The intersection of geopolitical developments, central bank actions, and massive corporate debt and equity issuance carries profound structural implications for global markets moving forward.

The Paper Supply Overhang
The most significant medium-term challenge to the equity rally is the shift in net equity supply. For the first time since 2021, the volume of new share issuance—driven by the $75 billion SpaceX IPO, secondary offerings, and Alphabet’s capital maneuvers—has outpaced corporate share buybacks.
Analysts warn that this deluge of paper threatens to absorb substantial market liquidity. Even though retail and institutional demand for technology and space-infrastructure assets remains historically high, the sheer volume of new supply means that aggregate cash reserves available to support broader market valuations are becoming increasingly constrained.
US Net Equity Supply Trend (2021 - Present):
[2021: Negative Supply (Buyback Dominated)] ---> [Current: Positive Supply (IPO/Secondary Dominated)]
                                                        |
                                                        v
                                         (Liquidity Drain on S&P 500)
AI Capex and the Credit Market Feedback Loop
The corporate landscape is also grappling with the escalating costs of artificial intelligence development. As the costs associated with frontier AI models escalate, enterprise buyers and startups are actively shifting toward cheaper, open-source, or optimized developer tools. This transition is putting immense pressure on leading model developers like OpenAI and Anthropic to revise their pricing structures.
This cost pressure has direct implications for corporate balance sheets and credit markets, as illustrated by Oracle Corp. The enterprise software giant saw its shares drop sharply after reporting quarterly capital expenditures that significantly exceeded consensus expectations.
To fund its aggressive AI data center expansion, Oracle has become the largest non-bank debt issuer in the Bloomberg Investment Grade Index over the past year, with plans to issue an additional $20 billion in debt over the next four quarters. Consequently, the AI narrative is rapidly transforming from an equity growth story into a credit-market leverage story, where rising debt-service costs could eventually pressure corporate margins.
Macroeconomic and Environmental Tail Risks
Finally, the broader macroeconomic outlook remains clouded by conflicting economic data and emerging environmental risks:
- The Federal Reserve’s Dilemma: The US Federal Reserve faces an inconsistent economic backdrop. While the May PPI print indicated persistent wholesale inflation at 1.1% month-on-month, core PPI figures and cooling labor data (evidenced by jobless claims rising to a four-month high of 229,000) complicate the path for monetary policy. If oil prices remain depressed due to the US-Iran MOU, the Fed will gain considerable breathing room; however, any breakdown in diplomatic talks would quickly revive the inflation scare.
- The El Niño Factor: Sitting in the background of the financial markets is a significant meteorological risk. The US Climate Prediction Center has projected a 65% probability of a strong El Niño event by the end of the calendar year, with a 40% chance of an extremely severe cycle. Such weather anomalies have historically disrupted global agricultural yields and escalated natural disaster frequencies, presenting an alternative inflationary impulse through food supply chains and insurance markets.
Conclusion
The current market environment represents a "relief rally with improved plumbing" rather than a definitive, long-term all-clear signal. While the reduction of the geopolitical war premium has allowed equities and bonds to stabilize, structural headwinds persist.
The market has effectively transitioned from acute geopolitical panic to a period of macroeconomic digestion. Until diplomatic agreements are formally signed, shipping lanes in the Strait of Hormuz are visibly verified as secure, and the market successfully absorbs the record influx of new equity supply led by SpaceX, investors are advised to maintain a balanced and disciplined approach to risk exposure.