
Gold has long occupied a unique, almost psychological space in the global financial markets. It is the perennial "safe haven," the historical hedge against debasement, and the ultimate store of value. Yet, for all its reputation as a bedrock asset, gold has an uncanny ability to frustrate the very investors who rely on it most.
In the current market cycle, we are witnessing a classic case of this frustration. Despite a macro environment that would traditionally ignite a rally—persistent inflation, escalating geopolitical instability, and a fraying confidence in fiat currencies—gold has moved in the opposite direction. It currently sits approximately 25% off its all-time high, leaving many market participants questioning the durability of the "gold thesis."
However, for the contrarian investor, these periods of disconnect are rarely signs of failure. Instead, they often represent the most compelling entry points in a multi-year cycle.
The Anatomy of the Current Pullback
To understand why gold is currently struggling, one must distinguish between long-term fundamental drivers and short-term liquidity mandates. The primary culprit for the recent downward pressure on bullion is the shifting landscape of interest rate expectations and the Federal Reserve’s hawkish posture.
Interest Rate Dynamics and Opportunity Cost
Gold’s greatest disadvantage in a high-rate environment is its lack of yield. Because the yellow metal pays no interest or dividends, it struggles to compete when the risk-free rate—specifically the yield on U.S. Treasuries—becomes attractive.

As inflation figures, such as May’s 4.2% year-over-year Consumer Price Index (CPI) reading, hit their highest marks in over three years, the market has begun to price in a "higher for longer" scenario. When investors perceive that the Federal Reserve may be forced into additional tightening to quell energy-driven inflation, capital naturally rotates out of non-yielding assets and into interest-bearing securities.
The Liquidity Trap
Beyond yield, there is the issue of forced liquidation. In periods of extreme market stress, investors are often driven by margin requirements rather than investment conviction. When equity markets experience volatility, portfolios must be rebalanced, and margin calls must be met. Gold, being a highly liquid asset, is frequently the first to be sold to raise cash, regardless of its long-term value. This technical selling, triggered by external market pressures, has effectively decoupled the gold price from its fundamental utility.
Chronology of the Shift: From Record Highs to Oversold Territory
The trajectory of gold over the past few years has been characterized by sharp, sentiment-driven swings.
- Late January: Gold reached a historic peak as market participants priced in peak inflation and maximum geopolitical anxiety.
- Q1/Q2 Transition: As the Federal Reserve signaled a more aggressive stance to combat sticky inflation, the "real yield" began to climb. Gold prices began their steady descent as the cost of holding the metal rose.
- Present Day: Using a 60-day percentage change oscillator, we can see that gold has moved deep into "oversold" territory. Historically, readings at these levels suggest that the selling pressure has become exhausted—a phenomenon often seen before a major trend reversal.
Supporting Data: Why the Fundamentals Hold
While the price action might suggest a loss of interest, the structural data tells a very different story. The case for gold is not built on short-term price movements, but on the persistent issues of debt and institutional demand.
1. The Debt Burden
The United States continues to operate with massive fiscal deficits, and there remains little to no political will in Washington to implement meaningful spending discipline. When the supply of fiat currency grows significantly faster than the economy, the purchasing power of that currency eventually diminishes. Gold remains the historical hedge against this specific form of monetary expansion.

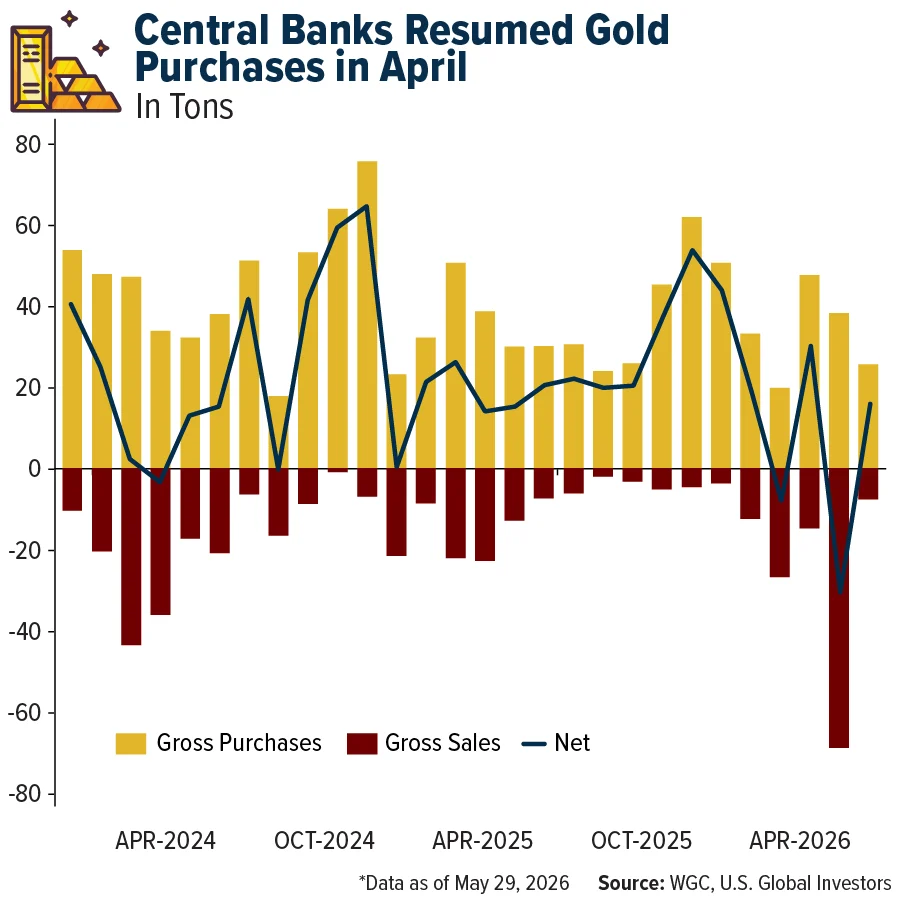
2. Central Bank Accumulation
Perhaps the most telling indicator of gold’s underlying health is the behavior of the world’s central banks. According to data from the World Gold Council (WGC), global institutions resumed net purchasing of gold in April. This suggests that while retail investors may be spooked by short-term rate hikes, the world’s most sophisticated institutional players view the current price levels as an accumulation opportunity.
3. The Structural Inflationary Backdrop
Even if headline inflation cools, the "structural" causes of rising prices remain. Supply chains, having been stressed by the pandemic and regional conflicts, remain fragile. Furthermore, the energy transition, while necessary, is proving to be inflationary, as the demand for power in the era of data centers and electrification outpaces current generation and transmission capabilities.
The Broader Hard-Asset Story: Aluminum and Copper
Gold does not exist in a vacuum. It is part of a broader ecosystem of hard assets that are currently experiencing supply-side constraints.
Aluminum and the Midwest Premium
The physical reality of the market is best illustrated by the "Midwest Premium" for aluminum. While global spot prices might suggest one thing, U.S. buyers are paying a massive premium—often double the base price—to secure physical supply. This indicates a profound tightness in the market that is being ignored by the broader equity indices. When manufacturers are forced to pay $6,000 per metric ton for a commodity that nominally trades at $3,500, it signals a systemic failure to meet demand that will eventually manifest in higher costs for everything from automotive manufacturing to defense systems.
The Case for Copper ("Doctor Copper")
Similarly, copper remains the essential building block of the modern economy. From the electrification of the grid to the expansion of AI-driven data centers, the world is more dependent on copper than ever. Fitch Ratings recently upgraded their price assumptions for both copper and aluminum, reflecting the reality that permitting for new mines is difficult, inventories are at historical lows, and geopolitical risk is creating a permanent "risk premium" on the cost of raw materials.

Implications: What Investors Should Monitor
For those looking to capitalize on this contrarian setup, three specific indicators warrant close attention:
- Real Interest Rates: Monitor the FedWatch tool. If the market begins to price in a pause or a reversal in rate hikes, the hurdle for gold ownership decreases, likely triggering a sharp move upward.
- ETF Flows: Keep a close eye on global gold-backed ETF holdings. While outflows have been the norm recently, a pivot to inflows will signal that the "smart money" is once again looking for safety.
- Gold Miner Equities: Often, the mining stocks act as a "leading indicator" for the metal itself. If miners begin to outperform the bullion price, it is a strong signal that the market is preparing for a sustained rally in gold.
Conclusion: A Strategic Approach
The current sentiment toward gold is undeniably negative, but for the contrarian, that is precisely the point. The technical signal shows an oversold asset, while the macro signal shows an environment defined by high debt, persistent inflation, and institutional buying.
For a well-balanced portfolio, I have long advocated for a 10% weighting in gold and gold-related assets. This is not an attempt to "time the market," but rather a defensive and opportunistic allocation: 5% in physical gold or bullion-backed exposure to act as a hedge against currency debasement, and 5% in high-quality gold mining equities to capture the leverage inherent in the sector during a recovery.
In a world where traditional assets are increasingly correlated to the whims of interest rate policy, gold remains the ultimate outlier. By maintaining exposure during these periods of extreme pessimism, investors position themselves to benefit when the market eventually shifts its focus back to the fundamental realities of debt, supply constraints, and the necessity of hard assets.
Disclaimer: All opinions expressed and data provided are subject to change without notice. Some of these opinions may not be appropriate to every investor. This article does not constitute financial advice. Investors should consult with a qualified financial advisor before making any investment decisions. Standard deviation is a statistical measurement that shows how far individual numbers in a dataset are spread out from the average (mean). The Consumer Price Index (CPI) is a statistical metric used to measure the average change over time in the prices paid by urban consumers for a fixed “market basket” of consumer goods and services.