
In the world of personal finance, few variables are as misunderstood—or as damaging—as the expense ratio. It is a quiet, persistent force that operates in the shadows of your brokerage account, systematically siphoning away your future wealth. While investors obsess over market volatility, interest rate hikes, and the latest stock market trends, they often overlook the one factor they can control with absolute precision: the cost of owning their investments.
An expense ratio is the annual fee that mutual funds and exchange-traded funds (ETFs) charge shareholders to cover their operating expenses, such as management fees, administrative costs, and marketing. It is expressed as a percentage of your total assets under management. While it may seem like a trivial decimal point, its cumulative effect over an investing lifetime is nothing short of catastrophic for the average retail investor.
The Mechanics of the "Hidden" Fee
Most investors cannot name the expense ratio of a single fund in their portfolio. This is not an accident; it is by design. Unlike a credit card annual fee or a subscription service, the expense ratio never arrives as a bill. You will never see a line item on your monthly statement that says, "Management Fee Deducted."
Instead, the fund manager "skims" the fee directly from the fund’s net asset value (NAV) before the performance data is ever reported to you. If a fund reports a 7% annual return, it is actually the return after the expense ratio has been subtracted. This makes the fee invisible to the untrained eye, creating a psychological disconnect where the investor feels they have paid nothing for the service of the fund management.
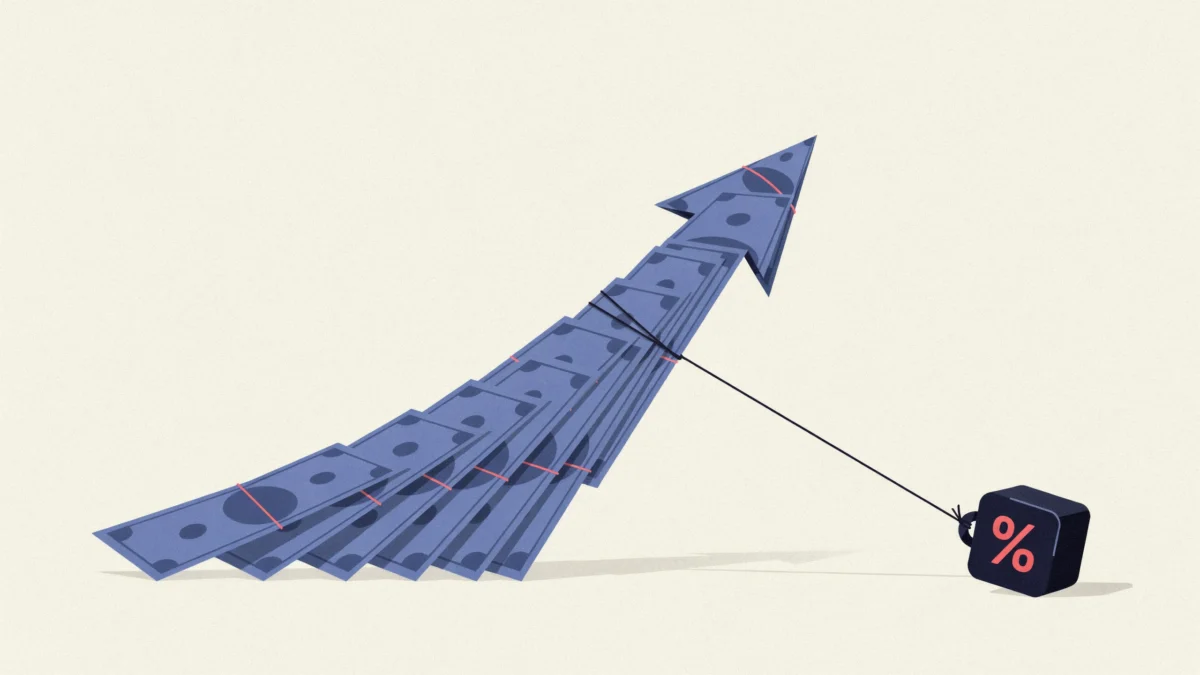
However, the cost is very real. Because the fee is charged as a percentage of your total balance—rather than a percentage of your profits—it behaves like a parasite. If your portfolio is worth $100,000, a 1% expense ratio costs you $1,000 per year. Even in a year where the market drops by 10%, you are still charged that 1% fee, effectively compounding your losses.
A Chronology of Compounding Drag
To understand the long-term damage, one must view the expense ratio not as a yearly expense, but as a multi-decade drag on the compounding process. Consider the trajectory of an investor who begins with $100,000 and earns a hypothetical 7% annual return over a 20-year period.
- Year 1: Both the low-cost investor (0.05% expense ratio) and the high-cost investor (1.0% expense ratio) see their portfolios grow. The gap is small—a mere $950 difference.
- Year 5: The compounding effect begins to accelerate. The low-cost investor sees their balance grow toward $140,000, while the high-cost investor trails by nearly $5,000.
- Year 10: The gap widens to over $15,000.
- Year 20: The final result is staggering. The low-cost investor, utilizing a broad index fund, ends with approximately $383,000. The investor stuck in a 1% fee fund ends with approximately $321,000.
That $62,000 difference is not just "lost fees." It is the loss of the growth those fees would have generated had they remained invested. This is the "opportunity cost" of high-fee funds, and it is the primary reason why passive, low-cost index investing has become the gold standard for long-term wealth accumulation.
Supporting Data: The Case for Low-Cost Funds
The data provided by financial researchers consistently demonstrates that cost is one of the most reliable predictors of future performance. The industry standard for low-cost index funds—often offered by brokerage giants like Vanguard, Fidelity, or Charles Schwab—frequently hovers between 0.03% and 0.05%.
Conversely, actively managed mutual funds often carry expense ratios ranging from 0.75% to 1.5% or higher. When you compare these two, you aren’t just comparing a $50 fee to a $1,000 fee; you are comparing two different investment philosophies.
A study by Morningstar analyzed the predictive power of expense ratios and concluded that low-cost funds are significantly more likely to outperform their peers over long time horizons. Because active managers must constantly beat the market to justify their higher fees, they are fighting an uphill battle against the "drag" of their own management costs. Statistically, the vast majority of active managers fail to beat their benchmark index over a 10- or 20-year period. When you factor in the higher fee, the probability of an active fund providing "alpha" (market-beating returns) drops precipitously.
Official Responses and Industry Shifts
The rise of the "Boglehead" movement and the increased transparency mandated by regulatory bodies like the SEC have forced the financial industry to respond. In recent years, the industry has seen a "race to the bottom" in terms of pricing. We have seen the introduction of zero-fee index funds, where brokerages eliminate the expense ratio entirely on certain products to attract assets.
However, the industry has also responded with "innovation" that often obscures costs. Target-date funds, for instance, are increasingly popular for retirement accounts. While they offer the convenience of automated asset allocation, they vary wildly in price. Some are constructed of low-cost underlying index funds (total expense ratio: 0.08%), while others are constructed of high-fee, proprietary active funds (total expense ratio: 0.75% or more).
Regulators have largely stayed out of the business of setting fee caps, opting instead for a disclosure-based approach. The burden, therefore, remains on the investor to perform the due diligence required to identify these costs.
Implications for Your Retirement Strategy
The implications of ignoring your expense ratios are profound. If you are 30 years old and planning to retire at 65, you are looking at a 35-year investment horizon. A 1% fee differential over 35 years can result in a difference of hundreds of thousands of dollars in your final nest egg.
What You Can Control
- Audit Your Portfolio: Log into your brokerage account or pull your 401(k) plan documents. Look for the "Expense Ratio" column. If you don’t see it, search for the fund’s ticker symbol on a site like Morningstar or Yahoo Finance.
- Compare Against the Benchmark: Compare your current fund’s fee against a plain-vanilla index fund that tracks the same market segment (e.g., an S&P 500 index fund). If your fund is charging 10 or 20 times more, ask yourself: Is this manager consistently providing enough value to justify the massive premium?
- Optimize Your Tax Strategy: If you are in a tax-advantaged account like a 401(k) or IRA, switching to a cheaper fund is a "no-brainer." There is no tax consequence for rebalancing within these accounts. In a taxable brokerage account, you must be more careful, as selling high-performing assets to switch to a cheaper fund could trigger a capital gains tax bill. In this scenario, you might consider keeping your current holdings and directing all future contributions into a lower-cost fund.
- Target-Date Fund Scrutiny: If you use a target-date fund for its "set it and forget it" convenience, don’t assume they are all priced the same. Check the prospectus and look for the "Total Annual Fund Operating Expenses."
Conclusion: The Ultimate Investment Choice
In the world of finance, there is very little you can truly control. You cannot control whether the market will be up or down next year. You cannot control geopolitical events, inflation spikes, or interest rate decisions. You are a passenger on the market’s roller coaster.
However, the expense ratio is the one variable that is entirely within your control. It is the only number you get to pick in advance. By choosing the lowest-cost options available to you, you effectively give yourself a guaranteed pay raise that compounds every single year. Do not let your wealth be eroded by the silent drag of unnecessary fees. In the long game of investing, the person who pays the least usually ends up with the most.
