
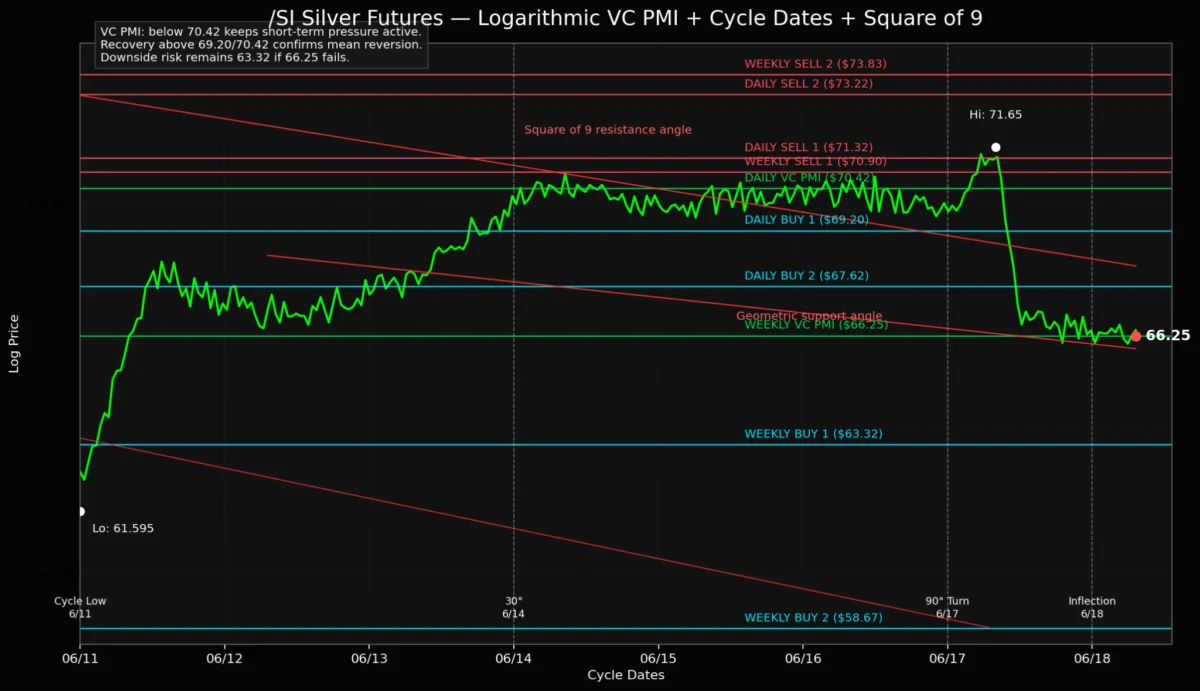
Silver futures are currently testing a critical technical juncture, trading at 66.25 as the market attempts to find a floor following a sharp retracement from recent highs. After failing to maintain price stability above the Daily Variable Changing Price Momentum Indicator (VC PMI) Mean of 70.42, the metal has entered a corrective phase that has drawn the attention of quantitative analysts and institutional traders alike. As silver approaches these key support levels, the confluence of geometric modeling, seasonal cycle analysis, and momentum indicators suggests that the market is nearing a pivotal inflection point that will dictate the near-term trajectory of the precious metal.
Main Facts: The Current Technical Landscape
The recent decline in silver futures, which retreated from a high of 71.65, has placed the asset firmly within a bearish short-term structure. According to the VC PMI Mean Reversion Model, the inability to sustain prices above the Daily Mean of 70.42 serves as the primary signal that the market is currently under distribution.
As of the latest trading sessions, silver is hovering near the 66.25 level, testing the lower boundaries of its current trading range. This level is not merely a random price point; it aligns with significant accumulation zones. The Daily Buy 2 level, identified by quantitative models at 67.62, acts as a primary target for institutional buyers looking to enter the market at a discount. Should the price continue to consolidate or drop further, the technical setup suggests that the market is preparing for a potential mean reversion rally.
The Bearish Shift
The transition from a bullish bias to a corrective phase was underscored by the failure at the 71.65 peak. When silver breached the Daily Mean of 70.42, the momentum shifted, signaling that the market had moved into a "short-term bearish condition." In quantitative trading terms, trading below the Daily Mean implies that the market is in an oversold state relative to its short-term average, which paradoxically increases the probability of a sharp, corrective bounce—provided that support levels hold.
Chronology of the Recent Market Retracement
The path to the current 66.25 price point was marked by several distinct phases, reflecting the interplay between market sentiment and algorithmic execution.
Phase 1: The Peak and Initial Exhaustion
Earlier in the cycle, silver displayed robust bullish momentum, climbing steadily toward the 71.65 mark. During this period, the market was supported by positive sentiment and a lack of significant overhead resistance. However, upon reaching the 71.65 level, the Square of 9 geometric analysis indicates that the market completed a short-term angular resistance cycle. This geometric exhaustion often triggers a reversal as algorithms and technical traders take profits at predetermined resistance clusters.
Phase 2: The Breakdown of the Mean
Following the peak, the market experienced a sharp decline. The critical breakdown occurred when the price fell through the VC PMI Daily Mean of 70.42. This level is a vital benchmark in quantitative trading; its loss serves as a psychological and technical catalyst for further selling. Once the mean was breached, the market structure shifted, and the focus moved from testing overhead resistance to searching for sustainable floor support.

Phase 3: Testing the Lower Boundaries
The current phase involves a test of the mid-66 area. This decline is viewed by proponents of harmonic retracement theory as a healthy adjustment within a larger trend. The price is currently oscillating near the Daily Buy 2 level of 67.62, representing a harmonic retracement of the prior advance. The market is now in a "wait-and-see" mode, where the duration of the stay below the mean will determine whether this is a temporary dip or the beginning of a more prolonged downward cycle.
Supporting Data: Quantitative Models and Geometric Perspectives
The analysis of silver’s current movement relies on two distinct yet complementary methodologies: the VC PMI Mean Reversion Model and the Square of 9 geometric framework.
The VC PMI Mean Reversion Model
The VC PMI (Variable Changing Price Momentum Indicator) is designed to identify high-probability areas of supply and demand. Currently, the model highlights two clear paths forward:
- Resistance Levels (The Upside): If the market finds support, the first major hurdle is the Daily Sell 1 level at 72.00, followed by the Daily Sell 2 level at 73.22. These are not arbitrary figures; they represent statistical "extremes" where the probability of a sell-off increases, as sellers typically re-emerge at these price points to defend their positions.
- Support Levels (The Downside): Conversely, the Daily Buy 1 level at 69.20 and the Daily Buy 2 level at 67.62 are identified as primary accumulation zones. When the price hits these levels, the model suggests that the probability favors a mean reversion rally—a return to the price average—rather than a total collapse of the trend.
The Square of 9 Perspective
The Square of 9, a cornerstone of W.D. Gann’s trading methodology, suggests that price and time are inextricably linked. By tracking silver’s movement against this geometric grid, analysts identified the 71.65 high as a point of angular resistance. The current decline into the mid-66 area is interpreted as a "harmonic retracement," which is a common occurrence after a significant price advance.
According to this framework, the market is approaching a critical inflection point. If the price manages a sustained close below the 66.00 threshold, the geometric model projects further downside pressure, potentially testing the Weekly Buy 1 level at 63.32. If, however, the price holds above current support, the geometric structure remains intact for a recovery back toward the Daily Mean.
Official Responses and Institutional Market Sentiment
While institutional "official responses" are rarely issued in the form of press releases, the collective sentiment of the market is reflected in the behavior of momentum indicators like the MACD (Moving Average Convergence Divergence).
Currently, the MACD indicator has compressed toward the zero line. In technical analysis, this indicates a significant loss of bullish momentum. However, it is important to note that the indicator has not yet confirmed a major trend reversal. The market is essentially "neutralizing" after a period of overextension.

Traders are being advised to watch for a recovery above 69.20. A breakout above this level would be the first tangible indication that buyers are regaining control and that the bearish pressure has subsided. A subsequent close above 70.42—the Daily Mean—would act as a secondary confirmation, effectively re-activating the upside targets of 71.32 and 73.22.
Implications: The Broader Bullish Framework
Despite the current short-term volatility, the secular bull market for silver remains fundamentally intact. The current weakness is categorized by market analysts as a corrective phase rather than a structural breakdown.
Seasonality and Volatility
The 2026 cycle structure, which has guided silver’s performance thus far, suggests that we are entering a window of increased volatility toward the latter part of June. Historically, when silver reaches these extremes—trading significantly below the VC PMI Mean while momentum indicators are oversold—the probability of a sharp reversal increases. For investors, this implies that the current "downturn" may actually represent a strategic entry point for those with a longer-term horizon.
The Path Forward
The implications for traders and investors are twofold:
- For the Short-Term Trader: The current focus should be on the 66.00 to 67.62 support range. If the market fails to hold these levels, risk management protocols should be triggered to account for a move toward the 63.32 support zone. Conversely, a bounce off 66.25 could provide a high-probability setup for a trade targeting the 70.42 mean.
- For the Long-Term Investor: The secular bull trend is supported by major weekly support levels that have yet to be breached. As long as these major structural supports hold, the current corrective phase is viewed as a necessary consolidation of gains before the next potential leg of the bull market.
Risk Management and Disclosure
It is imperative for all market participants to recognize that these quantitative models—while highly effective at identifying supply and demand—are not clairvoyant. The VC PMI and Square of 9 methodologies are tools for probability, not certainty.
Futures and options trading involve substantial risk. The market can remain irrational longer than any model can remain solvent. Investors are cautioned to consult with licensed financial professionals and to employ strict risk management strategies, such as stop-loss orders and position sizing, particularly during periods of heightened volatility as we approach the end of June. The market’s current test at 66.25 is a reminder that in the world of commodities, price is merely a reflection of the current battle between supply and demand, and the next move is rarely guaranteed until the market itself confirms the trend.
