

Posted on June 19, 2026 | By Adam Wespiser
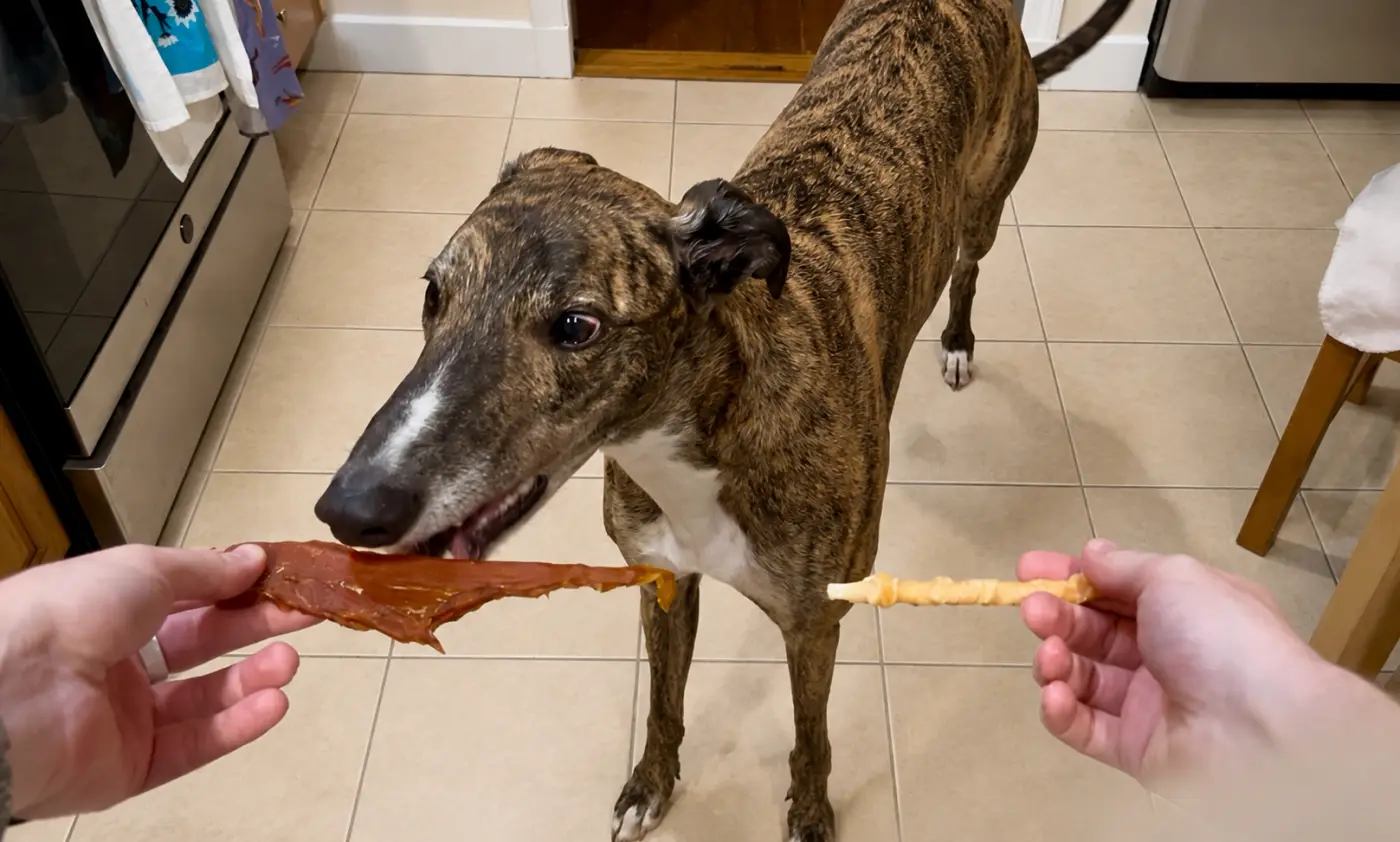
Bebop, an 83-pound, 33-inch-tall Greyhound with the elegance of a track star and the appetite of a scavenger, is a creature of simple, profound desires. He lives for the thrill of a full-throttle sprint, the comfort of shadowing his human around the house, and, most importantly, the pursuit of edible rewards. Whether it is a specialized chew treat, a slice of pizza pilfered from an unsuspecting party-goer, or a small, savory tray of cat food, Bebop possesses a discerning nose and the lightning-fast athleticism to secure whatever catches his fancy.
After years of observing his culinary habits, a realization dawned: despite his enthusiasm, I had no objective data regarding his true favorite. I was essentially guessing, unable to ask him directly. To resolve this, I turned to the rigor of statistics and the Bradley-Terry model to determine, once and for all, what snack truly reigns supreme in the world of Bebop.

The Mathematical Framework: Bradley-Terry and Elo
To decipher the canine palate, I employed the Bradley-Terry model, a standard statistical tool used to estimate the "strength" of participants based on pairwise comparisons. The model assigns each competitor—in this case, each dog treat—a positive strength score, $p_i$. Given two competitors, $i$ and $j$, the probability that $i$ beats $j$ is defined as:
$$Pr(i > j) = fracp_ip_i + p_j$$
This is conceptually similar to the Elo rating system, widely recognized for its application in professional chess. In the Elo system, ratings are updated incrementally to reflect performance against expectations, allowing for real-time adjustments as new data emerges. While Elo is superior for high-volume, continuous systems, the Bradley-Terry model is the ideal solution for a controlled, finite experiment where we seek a global ranking from discrete head-to-head encounters. This methodology has been utilized in everything from social media algorithms—most famously the early "FaceSmash" experiment by Mark Zuckerberg—to the modern, highly complex "Chatbot Arena" rankings for AI models. It is the gold standard for when you need a clear hierarchy from limited comparative data.

Chronology of the Experiment
The experiment was designed to be as unobtrusive as possible, fitting seamlessly into our daily routine. To maintain consistency, I established a "choice" command. Every night at 11:00 PM, I would present two different treats in my hands. Bebop, having been trained on the command, would sniff both before making his selection. One treat would be consumed; the other was returned to the bag.
Phase 1: Selection and Calibration
I curated a list of treats ranging from legacy favorites like Greenies to various new formats sourced from Amazon. While the treats varied slightly in size and caloric density, I consciously decided to treat them as equivalent units. To account for potential size bias, I scheduled the trials two hours after dinner, ensuring Bebop was neither starving nor completely uninterested. I prioritized the consistency of the testing environment over the labor-intensive process of weighing individual snacks.
Phase 2: Execution and Data Collection
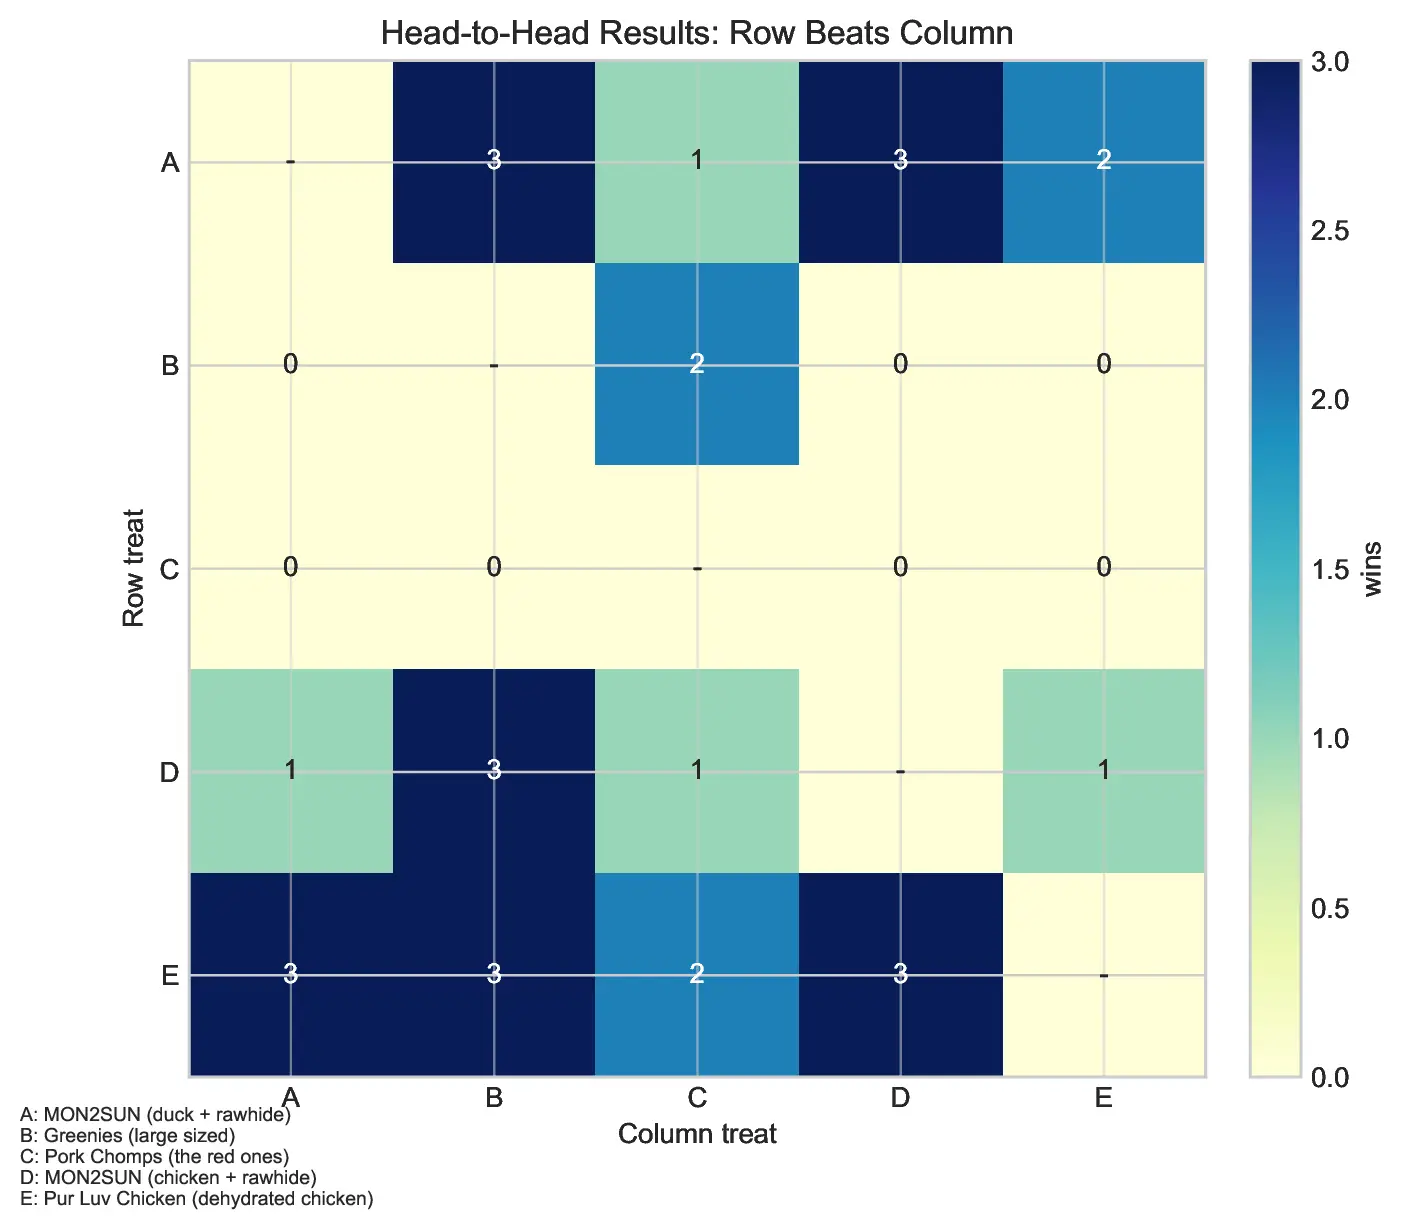
Each day involved two head-to-head comparisons. I maintained meticulous records, noting which treat was held in which hand to control for positional bias. The dataset, hosted on GitHub, eventually provided enough signal to identify clear winners and losers.
Midway through the trials, a pattern emerged. "Pork Chomps" and Greenies were consistently underperforming, losing to almost every other candidate. To improve the statistical power of the experiment, I made the executive decision to retire these underperformers and concentrate exclusively on the top-tier contenders. This allowed me to focus the remaining trials on the most competitive matchups, ensuring the final rankings were as precise as possible.
Supporting Data: The Analysis of Bias and Preference
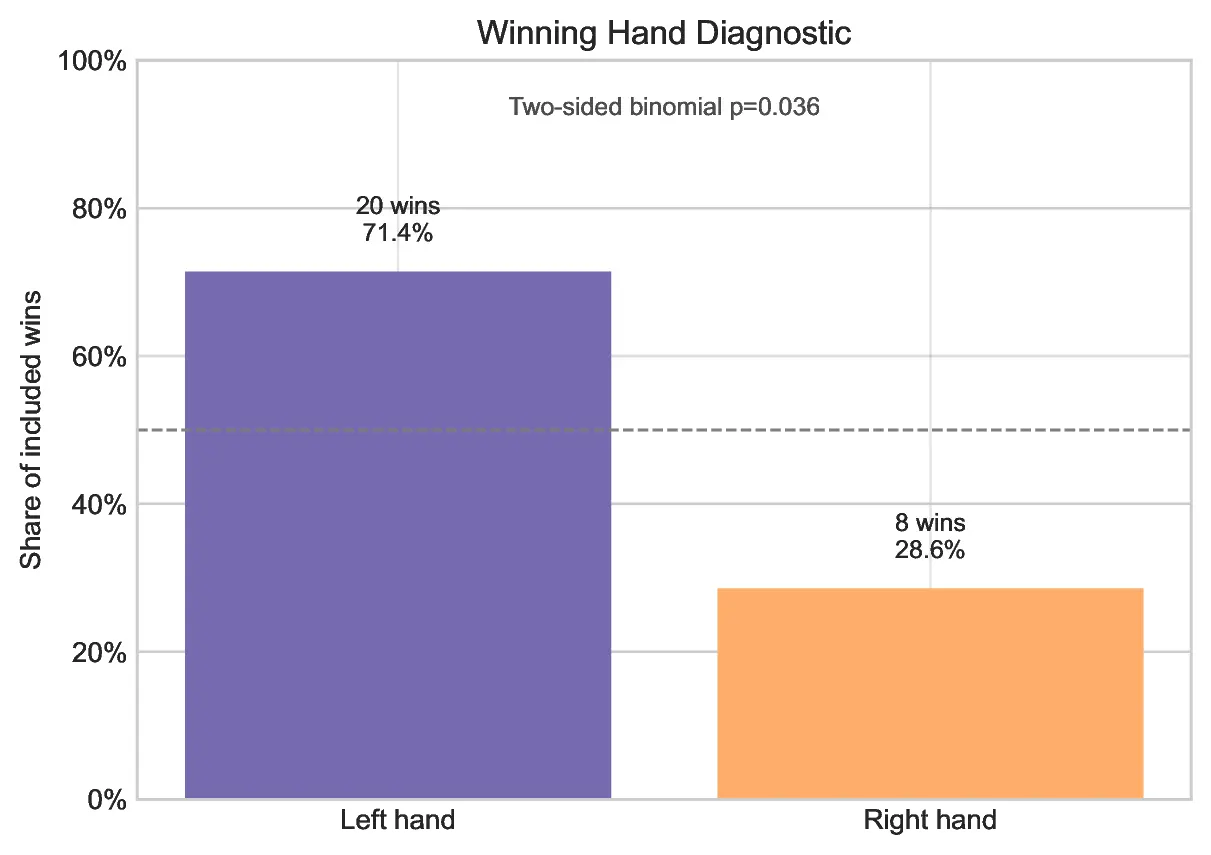
The data collection revealed an unexpected variable: a measurable right-side bias. In trials where identical treats were offered in both hands, Bebop consistently chose the treat presented on his right side (my left hand). While this does not necessarily mean he is "right-pawed," it highlights an environmental factor. My kitchen setup is non-symmetrical; the left side is adjacent to a window fan that was occasionally active during testing. This uncontrolled variable likely influenced his selection process, underscoring the importance of rigorous, multi-variate analysis in behavioral studies.
The Results: A New Champion
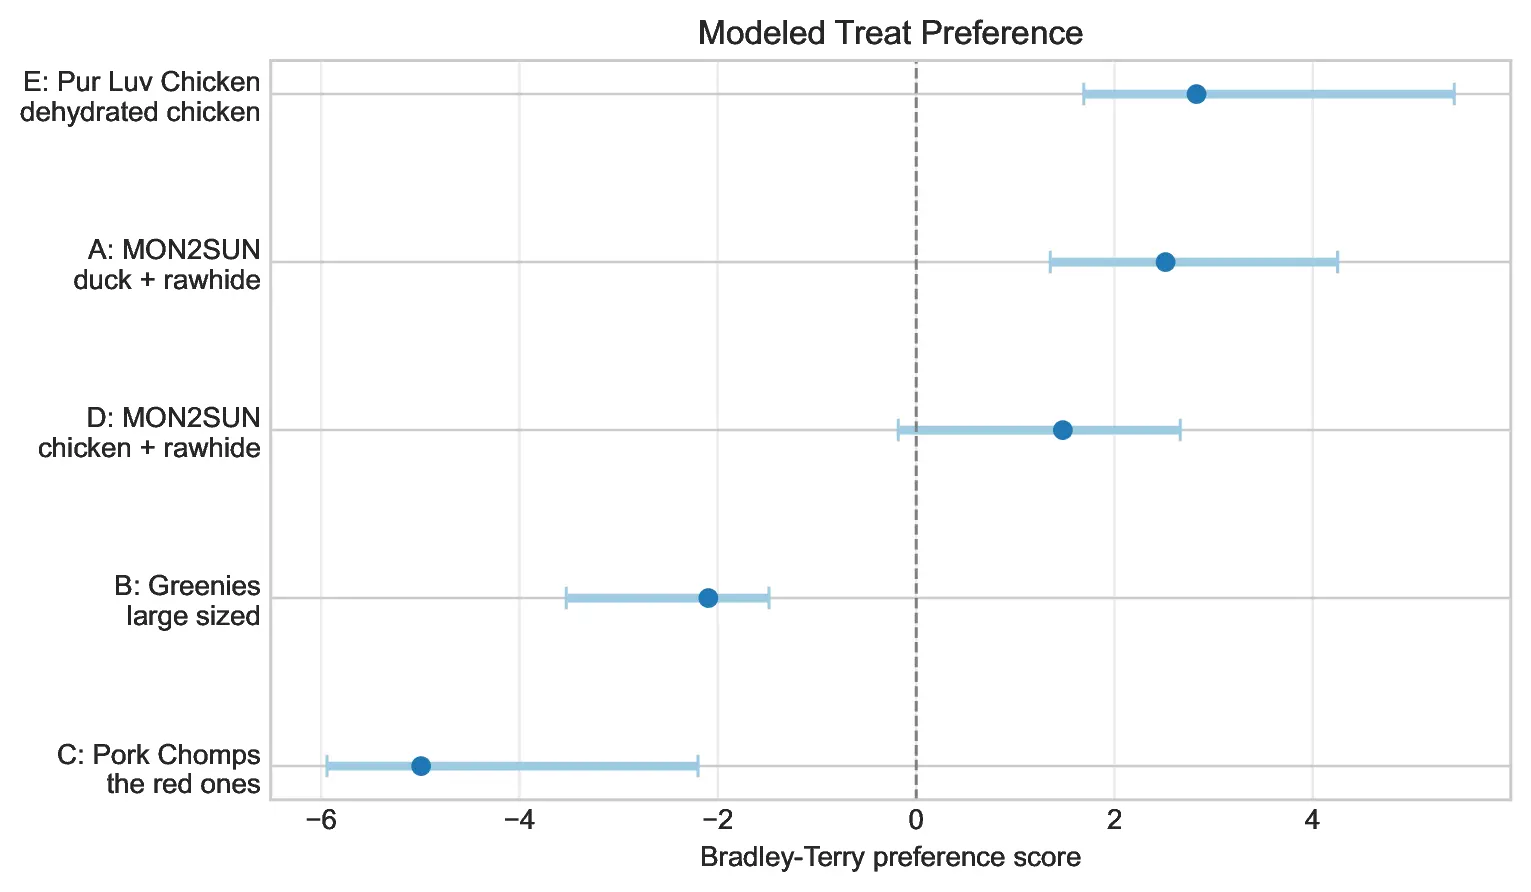
The Bradley-Terry analysis produced a clear, albeit evolving, leaderboard. Treat E (Pur Luv Chicken) emerged as the current champion. The data provides strong evidence that treats B and C are statistically inferior, while treat A remains a viable, if slightly weaker, challenger. The head-to-head record for E vs. A stands at 3–2, resulting in a model-implied probability of E beating A at 57.5%.
To ensure these results weren’t a product of noise, I conducted a bootstrap experiment. By repeatedly resampling the trials and fitting new Bradley-Terry models, I found that Treat E finished in the top position in 63% of simulations, compared to 33% for Treat A, and a meager 4% for Treat D.
Implications and Future Directions
The implications of this experiment are two-fold: first, it confirms that data science can be applied to even the most mundane aspects of pet ownership to yield actionable, fascinating results. Second, it highlights the inherent "unsettled" nature of subjective preference.
The current champion, Pur Luv Chicken, fits the evolutionary profile of a Greyhound—a breed historically bred for speed and high-protein intake. The fact that he prefers dried chicken over processed alternatives is a logical finding. However, the closeness of the contest between E and A suggests that the hierarchy is not yet set in stone.
Moving Forward
The logical next step is a targeted, high-frequency series of trials exclusively between Treat E and Treat A. By eliminating the lower-performing variables, we can tighten the confidence intervals of the model and reach a more definitive conclusion. Bebop, for his part, remains an enthusiastic and tireless participant in the scientific process, appearing ready to continue the trials indefinitely.
For those interested in replicating this experiment or analyzing the raw data, the source code and logs are available on the project’s GitHub repository. The use of these statistical methods demonstrates that with enough patience and a bit of math, we can bridge the communication gap between human and canine, turning an everyday treat into a data-driven insight.
This experiment serves as a reminder that the world around us is full of variables waiting to be measured. Whether it is optimizing a machine learning model or optimizing a dog’s snack time, the principles of probability and competitive analysis remain the most effective path toward clarity. As we continue to refine the model, we look forward to finalizing the ranking and perhaps, in the future, expanding the experiment to include a broader range of human-grade snacks to see if Bebop’s refined palate holds true across different categories of food.
For now, the winner is clear. Treat E holds the crown, but the experiment continues—one sniff, one choice, and one treat at a time.
