
A more hawkish-than-anticipated stance from the Federal Reserve has sent ripples through global financial markets, prompting investors to aggressively price in another interest rate hike by autumn. However, beneath the surface of the Federal Open Market Committee’s (FOMC) hawkish posturing lies a deeply divided policymaking body, a highly concentrated labor market, and powerful, building disinflationary forces.
While market participants have rushed to adjust their portfolios for higher-for-longer interest rates, a comprehensive analysis of underlying economic indicators suggests that the central bank’s next move may not be a hike at all. Instead, a prolonged pause extending into the summer of next year appears to be the most credible path forward.
Main Facts: The Divergent Path of US Monetary Policy
The June meeting of the FOMC revealed a significant hawkish shift in the central bank’s collective outlook. For the first time in recent quarters, half of the committee members now project at least one more rate hike before the end of the year—a stark contrast to the unanimous expectation of a pause or rate cuts held in March. This shift has dramatically altered market expectations:
- Market Pricing: Investors have now fully priced in a 25-basis-point (bp) rate hike by October, with futures markets increasingly penciling in a second tightening move by early 2027.
- The Policy Split: Despite the hawkish headline signal, the FOMC is precisely split down the middle. Half of the committee does not believe further rate hikes are necessary.
- The Dual Mandate: Unlike its international peers, such as the European Central Bank (ECB) and the Bank of Japan (BOJ), which operate under single-target mandates focused solely on price stability, the Federal Reserve must balance a dual mandate: achieving 2% long-term inflation while maximizing sustainable employment.
- Diverging Forecasts: The Federal Reserve’s updated fourth-quarter forecasts for headline inflation stand at 3.3% for 2026 and 2.5% for 2027. These figures sit notably higher than the Bloomberg private-sector consensus of 3.1% and 2.3%, respectively, indicating that the Fed is modeling a much stickier inflation environment than private economists expect.
Chronology: From Labor Froth to Disinflationary Headwinds (2022–2026)
To understand the current monetary policy crossroads, it is essential to trace the macroeconomic trajectory of the past four years:
- 2022 (The Peak of Labor Market Tightness): The US labor market reaches unprecedented levels of tightness, characterized by an extreme imbalance of two job vacancies for every single unemployed American. This labor shortage drives rapid wage growth and fuels broader services-sector inflation.
- January 2025 – February 2026 (The Labor Lull): Non-farm payroll growth slows dramatically, averaging a meager 8,500 jobs per month. This prolonged stagnation sparks concerns over a broader economic slowdown.
- Spring 2026 (The Rebound): Over the past three months, non-farm payrolls experience a sharp, unexpected rebound, averaging 188,000 new jobs per month. This resurgence triggers hawkish alarms within the FOMC.
- Late May 2026 (The Energy Peak): National average retail gasoline prices peak at $4.60 per gallon, compounding inflationary pressures and keeping headline consumer price index (CPI) prints elevated.
- June 2026 (The Present Crossroads): The Federal Reserve delivers its hawkish June pause/projection update. Concurrently, gasoline prices retreat below $4.00 per gallon, setting the stage for negative month-on-month headline CPI prints in the summer of 2026.
Macroeconomic Timeline: 2022 – Summer 2026
┌────────────────────────┐      ┌────────────────────────┐      ┌────────────────────────┐
│          2022          │      │  Jan 2025 - Feb 2026   │      │      Spring 2026       │
│  Extreme Labor Froth   │ ───> │  Payrolls Slump to     │ ───> │  Headline Rebound to   │
│  (2:1 Vacancy Ratio)   │      │  Avg 8,500/Month       │      │  188k/Month (Narrow)   │
└────────────────────────┘      └────────────────────────┘      └────────────────────────┘
                                                                            │
                                                                            ▼
┌────────────────────────┐      ┌────────────────────────┐      ┌────────────────────────┐
│      Summer 2027       │      │  Late June/July 2026   │      │     Mid-June 2026      │
│  Anticipated End of    │ <─── │  Expected Negative     │ <─── │  Fed Shifts Hawkish;   │
│  Prolonged Fed Pause   │      │  MoM CPI Prints        │      │  Gas Drops Below $4    │
└────────────────────────┘      └────────────────────────┘      └────────────────────────┘
Supporting Data: A Deep Dive into US Economic Metrics
The argument for a prolonged pause rather than continued rate hikes is supported by a granular examination of labor, wage, and inflation data.
The Employment Paradox: Headline Payrolls vs. Main Street Sentiment
While the recent three-month average of 188,000 new jobs per month appears robust on paper, a closer inspection reveals structural vulnerabilities:
- Sectoral Concentration: Virtually all recent job creation has been concentrated in just three sectors: government, private education & healthcare services, and leisure & hospitality. The broader private sector—including manufacturing, professional services, and construction—remains flat or in decline.
- Divergent Business Surveys: This apparent hiring surge is conspicuously absent from leading business surveys. Neither the Institute for Supply Management (ISM) employment indices nor the National Federation of Independent Business (NFIB) hiring intentions surveys show any corresponding uptick. Similarly, real-time daily job vacancy data from private platforms like Indeed continue to point downward.
- Bleak Consumer Sentiment: Workers themselves are not experiencing a booming job market. The University of Michigan consumer sentiment index reveals that a net 54% of households expect unemployment to rise over the coming 12 months. This level of pessimism is historically rare, matching the depths of the Global Financial Crisis (GFC) and the severe recessions of the early 1980s and early 1990s.
- Downward Revision Risk: Historically, during periods of economic transition, initial payroll estimates are prone to significant downward revisions during the Bureau of Labor Statistics’ (BLS) annual benchmarking exercises. Given the disconnect between headline payrolls and business surveys, a major downward reappraisal of 2026 employment data remains a distinct possibility.
Wage Dynamics, Labor Churn, and the Quits Rate
The inflationary "froth" that characterized the post-pandemic recovery has largely dissipated. The ratio of job vacancies to unemployed workers has normalized from its 2:1 peak in 2022 to a balanced 1:1 ratio today.
Labor Market Churn & Wage Growth Relationship
┌──────────────────────────────────────┐ ┌──────────────────────────────────────┐
│ 2022 Labor Market Peak │ │ Current 2026 Balance │
├──────────────────────────────────────┤ ├──────────────────────────────────────┤
│ • Vacancy-to-Unemployed Ratio: 2:1 │ │ • Vacancy-to-Unemployed Ratio: 1:1 │
│ • Quits Rate: Historically Elevated │ ──> │ • Quits Rate: Rapidly Plummeting │
│ • Corporate Strategy: Paying to Retain│ │ • Corporate Strategy: Cost Control │
│ • Wage Growth: Highly Inflationary │ │ • Wage Growth: Consistent with 2% CPI│
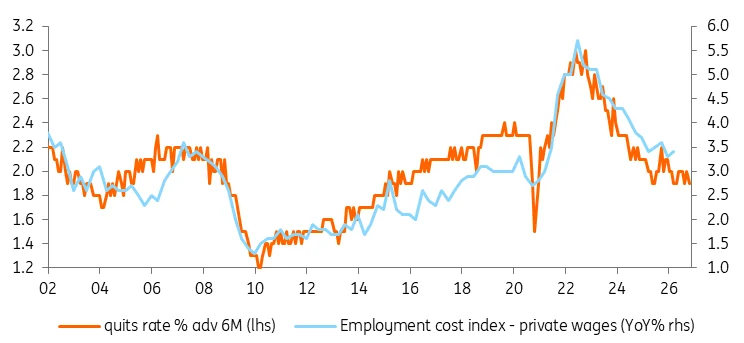
└──────────────────────────────────────┘ └──────────────────────────────────────┘This rebalancing is best illustrated by the dramatic decline in the "quits rate"—the percentage of workers voluntarily leaving their jobs for other opportunities. Because job-switchers typically command the highest wage premiums, a falling quits rate indicates that companies no longer need to offer aggressive salary increases to retain staff or attract talent. Wage growth of approximately 3% is now highly achievable, a rate that economic models show is fully compatible with the Fed’s 2% consumer price inflation target.
Inflation Breakdown: Gasoline, Shelter, and Tariff Dynamics
The Fed’s conservative inflation forecasts contrast sharply with immediate real-world price trends. Multiple leading indicators point to a rapid deceleration in inflation over the next two quarters:
- Energy Relief: Having peaked above $4.60 per gallon in late May, national average gasoline prices have fallen below $4.00 per gallon and are projected to reach $3.75 by mid-summer. This rapid drop is set to drive negative month-on-month headline CPI prints for June and July, while simultaneously lowering freight and transportation costs.
- The Shelter Lag: Shelter (housing and rent) carries a massive 35% weighting in the Consumer Price Index. While official CPI shelter inflation is still lagging at around 3.5% year-on-year, real-time private sector metrics from Zillow and Realtor.com show that home prices are barely rising at 1% annually, and rents are actively falling in a growing number of states. As this real-time data slowly feeds into the official government metrics over the next 12 months, it will exert a powerful downward drag on core CPI.
- Tariff Exclusions: While tariffs represent a one-off upward shift in price levels, the transition to a more flexible tariff regime—complete with extensive product exemptions—means their inflationary impact is set to fade. The Dallas Fed estimates that tariffs currently add roughly 0.9 percentage points to the annual core Personal Consumption Expenditures (PCE) deflator. As these tariff-related price hikes wash out of the year-on-year comparisons, core inflation should drop quickly.
Official Responses: The Fed’s Divided Mandate and Warsh’s Caution
The policy debate within the Federal Reserve highlights the unique challenge of its regulatory framework compared to other major central banks.
The Dual Mandate vs. Single-Target Peer Institutions
While the ECB and the BOJ recently enacted 25-basis-point rate hikes to combat persistent localized price pressures, both institutions operate under a singular focus: price stability.

Central Bank Mandate Comparison
┌────────────────────────────────────────────────────────────────────────┐
│                          FEDERAL RESERVE (US)                          │
├────────────────────────────────────────────────────────────────────────┤
│ • Mandate: Dual Mandate                                                │
│ • Objectives: Price Stability (2%) AND Maximum Sustainable Employment   │
│ • Policy Constraint: Must balance labor market cooling against inflation│
└────────────────────────────────────────────────────────────────────────┘

┌────────────────────────────────────────────────────────────────────────┐
│                EUROPEAN CENTRAL BANK / BANK OF JAPAN                   │
├────────────────────────────────────────────────────────────────────────┤
│ • Mandate: Single Mandate                                              │
│ • Objectives: Price Stability (2% inflation target)                    │
│ • Policy Constraint: Can aggressively hike rates despite labor slowing  │
└────────────────────────────────────────────────────────────────────────┘
The Federal Reserve, by contrast, must carefully weigh the risk of overtightening. If the FOMC continues to raise rates in response to backward-looking inflation data, it risks causing an abrupt contraction in a labor market that is already showing signs of underlying weakness.
Chair Warsh’s Assessment of Policy Restrictiveness
In his post-meeting press conference, Federal Reserve Chair Kevin Warsh struck a measured tone, refusing to offer explicit personal guidance on the future path of interest rates. However, he made a crucial distinction regarding the transmission of monetary policy:
"Monetary policy does not appear particularly restrictive when one looks at the robustness of financial markets, but it certainly looks restrictive when viewed through the lens of the housing market."
Given that housing and shelter are the single largest components of consumer inflation, this admission is highly significant. It suggests that the sectors of the economy most sensitive to interest rates are already responding to the Fed’s past tightening cycle, making further rate hikes increasingly difficult to justify.
Implications: The Case for a Prolonged Pause to Summer 2027
The divergence between hawkish policymaker rhetoric and weakening economic fundamentals presents a clear set of implications for financial markets and monetary policy over the coming year:
1. Market Re-Pricing and the September Dot Plot
The current market pricing, which fully anticipates an October rate hike and contemplates another move in early 2027, appears overdone. As soft headline inflation prints for June and July emerge, driven by falling gasoline prices and declining shelter costs, market sentiment is likely to shift. By the time the FOMC releases its next Summary of Economic Projections (the "dot plot") in September, it is highly probable that far fewer than nine committee members will still be projecting a rate hike before year-end.
2. Anchorage of Inflation Expectations
A key concern for any central bank is the unanchoring of inflation expectations, which can trigger wage-price spirals. Currently, consumer inflation expectations remain well within tolerable historical ranges.
More importantly, market-based inflation expectations have declined significantly: 10-year breakeven inflation rates are trading in line with their 25-year historical average, while 2-year breakeven rates have dropped below 2.2%. This market pricing indicates strong confidence in rapid disinflation, even with headline CPI currently running at 4.2%.
3. The Long Pause
The Federal Reserve is highly sensitive to its inflation-fighting credibility, having faced criticism for missing its inflation target over the preceding five years. Chair Warsh is determined to secure a return to price stability. However, with half of the FOMC already opposed to further rate hikes and the real economy signaling a cooling labor market and declining rents, the bar for another rate hike is exceptionally high.
The most likely outcome is a prolonged policy pause. The Fed is poised to keep the federal funds rate steady at current restrictive levels, allowing the cumulative effects of its past rate hikes to continue working through the financial system. This pause is likely to extend through the end of 2026 and persist until the summer of 2027, providing a stable, albeit restrictive, interest rate environment as inflation steadily returns to the 2% target.
