
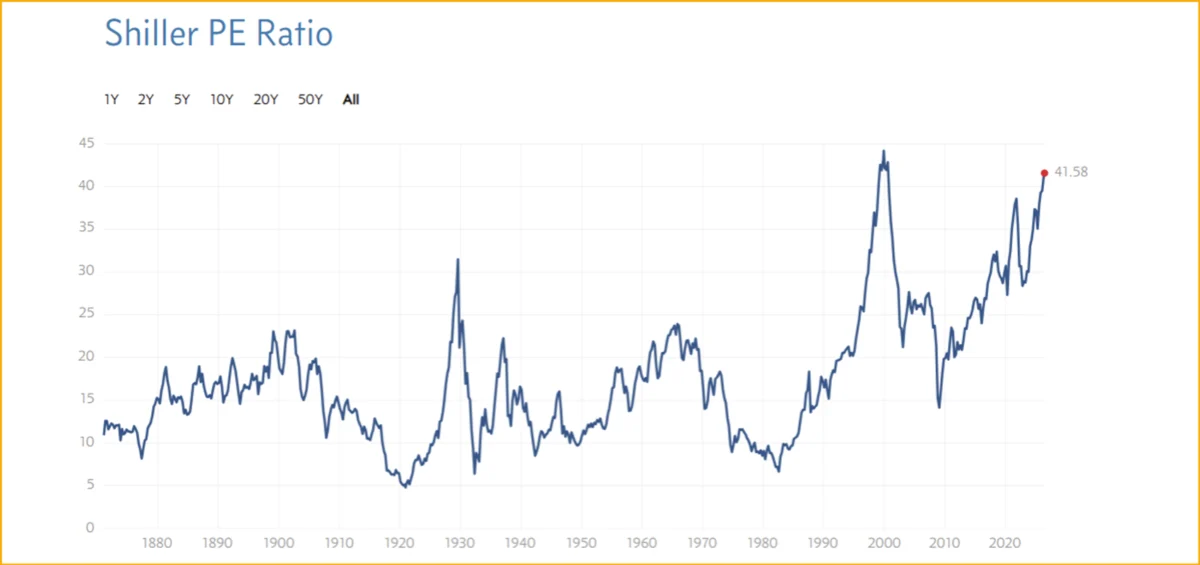
The global financial landscape is currently defined by a precarious tension between historically high equity valuations and an even more dangerous deterioration of the sovereign credit profile of the United States. While market analysts frequently focus on the Shiller CAPE (Cyclically Adjusted Price-to-Earnings) ratio as a barometer for stock market excess, a more alarming narrative is unfolding within the U.S. Treasury market. The structural integrity of the American fiscal apparatus is being tested by a lethal combination of debt accumulation, inflationary pressure, and a shrinking gold-to-GDP ratio.
The Fiscal Crossroads: A Chronology of Debt Escalation
To understand the severity of the current predicament, one must look back at the historical precedents of American stagflation. In 1979, the United States was grappling with the zenith of a 40-year stagflation cycle. During that period, interest rates hovered near 15%. At the time, the national debt stood at approximately $800 billion. Consequently, the annual interest expense for the government was roughly $120 billion—representing approximately 25% of annual federal tax revenues.

Fast forward to the present day, and the mathematical reality has shifted into a "doom loop" territory. With the national debt now exceeding $40 trillion, the application of 1979-era interest rates—a 15% yield—would result in an annual interest expense of $6 trillion. Given that annual federal revenues currently hover near $5 trillion, the math is undeniable: interest payments would exceed 100% of the government’s intake.
Key Milestones in the Current Debt Trajectory:
- The Era of Artificial Liquidity: Post-2008, the Federal Reserve’s reliance on quantitative easing and artificially suppressed interest rates created a "powder keg" effect. By keeping borrowing costs low, the government was incentivized to ramp up debt issuance rather than address structural deficits.
- The Gold Disconnect: Historically, the U.S. dollar was tethered to a gold standard that provided a baseline of fiscal discipline. In 1940, with a population of 130 million, the U.S. held 20,000 tons of gold. Today, with a population approaching 350 million, the government’s gold holdings have dwindled to roughly 8,000 tons.
- The GDP Mirage: While U.S. GDP has expanded nearly 300-fold in nominal fiat terms since 1940, the physical asset base—gold—has shrunk by 60%. This represents a massive dilution of the government’s ability to backstop its currency against systemic volatility.
Supporting Data: Why Equities and Bonds Are Intertwined
The long-term chart of the Dow Jones Industrial Average suggests a market buoyed by artificial stimulants rather than organic growth. Money printing and low-interest rate policies have allowed equity valuations to reach record highs. However, these metrics are deceptive when viewed in isolation.

When a stock market collapse coincides with a spike in inflation—a scenario currently feared by many institutional investors—the government faces a "fiscal pincer movement." A market crash leads to reduced capital gains and income tax revenues, which craters the federal budget. Simultaneously, if inflation forces interest rates higher to compensate lenders for the loss of purchasing power, the cost of servicing the $40 trillion debt load spikes. This is the definition of a government bankruptcy event.
The volatility in the 10-Year Treasury Yield ($TNX) indicates that the market is beginning to price in this instability. As yields oscillate, the cost of borrowing for the U.S. Treasury becomes increasingly unpredictable, further fueling the argument that the current debt-oriented model is unsustainable.

Official Responses and Policy Stagnation
To date, the federal response to this growing debt crisis has been characterized by "kicking the can down the road." There has been a notable lack of meaningful policy shifts, such as the introduction of a new gold buy program.
Experts suggest that the only viable path to avoid "financial Armageddon" involves a two-pronged strategy:

- Re-monetization of Gold: Initiating a strategic gold acquisition program, starting at roughly 50 tons per month, to restore confidence in the dollar’s underlying value.
- Fiscal Consolidation: A disciplined, ongoing reduction in government spending to narrow the gap between revenue and expenditure.
Despite these recommendations, political gridlock remains the primary obstacle. In the absence of legislative action, the market has been forced to hedge its own risk, driving the recent interest in precious metals and gold-linked assets as "supreme money."
Market Implications: Navigating the "Oversold" Landscape
For the savvy investor, the current environment is not just one of danger, but of significant opportunity. The price action in gold and gold-related mining stocks has provided a roadmap for those looking to protect their purchasing power.

Technical Analysis of Gold and Mining Assets
- The Double Bottom Pattern: Recent hourly charts for Gold Spot indicate that the asset may be carving out a double bottom near the $4,000 level. If this support holds, technical analysts project a potential surge toward the $4,700–$4,900 range.
- Oversold Oscillators: The 14,5,5 Stochastics oscillator has hit oversold territory on a weekly basis, a signal that historically precedes a strong rally. While the timing of the "turn" is never certain, the setup suggests the downside risk is increasingly mitigated by buyer interest.
- The 2026 Swing Trader Success: Those who monitored key support zones in early 2026—specifically the $4,400 gold support, the 45,000 Dow support, and the $4,100 gold dip—have seen significant returns. Many mining stocks within the GDX ETF have surged between 30% and 100% following these strategic entries.
The Path Forward: Confidence in a Fractured System
The central question facing investors today is not whether the U.S. government faces a debt crisis, but how that crisis will manifest. Will it be through a controlled devaluation, a period of hyper-inflation, or a structural reorganization of fiscal priorities?
The current trend of "fiat bankruptcy"—the process by which a government loses the ability to pay its debts in real terms—is an ongoing process, not a singular event. For the average citizen, the ability to shield oneself from this mayhem rests on the recognition of "supreme money." Gold and silver are no longer just commodities; they have regained their status as the primary insurance policy against the systemic failure of sovereign credit.

As we look toward the remainder of the year, the "gold bugs" who have maintained their positions through the volatility are beginning to see their patience rewarded. With gold miners demonstrating a 60% gain for the year thus far, the momentum suggests that market participants are increasingly losing faith in the "debt-at-any-cost" fiscal model.
In conclusion, while the macro-economic data paints a picture of a debt-oriented powder keg, the market is providing clear signals on where to hide. The "buy zones" established in 2026 serve as a testament to the resilience of hard assets in an age of fiscal uncertainty. Whether the U.S. government chooses to pivot toward a gold-backed, fiscally responsible future or continues its current trajectory, the role of precious metals as a cornerstone of wealth preservation remains more critical now than at any point in the last four decades. Investors who act with the confidence to purchase in these key zones are likely to be the ones who successfully navigate the coming financial storm.
