
The modern macroeconomic landscape presents a puzzling contradiction that challenges traditional financial narratives. On one side, public discourse is dominated by stories of systemic financial distress: wage stagnation, a punishing cost-of-living crisis, and younger generations locked out of the housing market. On the other side, Wall Street is experiencing an unprecedented deluge of liquidity, with retail inflows into stocks, options, and exchange-traded funds (ETFs) reaching historic highs.
How can a population supposedly struggling to cover basic necessities simultaneously fuel one of the most aggressive market melt-ups in history?
The answer lies in the structural mechanics of a deeply polarized, "K-shaped" economy. By distinguishing between the flow of new income and the existing stock of accumulated wealth, the apparent contradiction dissolves. What emerges is a highly concentrated financial system where record-breaking liquidity, corporate buybacks, and systemic leverage are driving asset prices upward, even as a significant portion of the population remains financially vulnerable.
1. Main Facts: The Dual Realities of Modern Finance
To understand the current market, one must reconcile two seemingly incompatible phenomena occurring in parallel:

- The Squeezed Consumer: Broad indicators of household financial health suggest widespread vulnerability. According to consumer surveys, nearly half of all Americans lack the liquid savings to cover a minor emergency, while cumulative inflation has outpaced low-end wage growth over the last several years.
- The Wall Street Deluge: Simultaneously, retail capital is pouring into risk assets at an unprecedented pace. Retail money market fund balances, equity purchases, and options volumes have all hovered near record levels.
                      ▲ [Upper Arm of the K]
                      │  • Top 10% own 87% of equities ($50T)
                      │  • Trillions in Money Market Funds migrating to risk
                      │  • Corporate buybacks hitting record highs ($926B YTD)
                      │
──────────────────────┼─────────────────────────────────────────────────── [Macroeconomic Baseline]
                      │
                      │  • Real wages pressured by cumulative inflation
                      │  • Personal savings rate near historic lows (2.6%)
                      │  • 53% of households unable to cover $1,000 emergency
                      ▼ [Lower Arm of the K]
This divergence is explained by the K-shaped economy, characterized by a widening gap between asset owners and wage earners. While the lower portion of the "K" experiences the direct bite of inflation on daily expenses, the upper portion has seen its net worth expand dramatically through real estate and equity appreciation.
Crucially, the stock market does not run on the monthly cash flow of the average wage earner; it runs on the massive stock of existing wealth held by the upper-middle and wealthy classes, supplemented by corporate self-investment and high-beta leverage.
2. Chronology: The Road to the Liquidity Surge
The structural imbalances defining today’s market did not appear overnight. They are the result of a multi-decade transition accelerated by recent monetary and fiscal policy shifts.
[1967–2022] ──► [2010–2019] ──► [2020–2022] ──► [2023–2024] ──► [Mid-Year Pivot]
Middle class    Post-GFC        Pandemic        5% yields       Fed adopts a
shrinks as      expansion;      stimulus &      lock cash;      hawkish hold;
households      401(k) auto-    inflation       rotation to     leverage risk
move upward.    enrollment.     surge (26%).    risk begins.    amplifies.
The Long-Term Shift (1967–2022)
Over the last half-century, the distribution of household income in the United States underwent a profound transformation. In 1967, approximately 54.6% of households were classified as middle-income (earning between $35,000 and $100,000 in inflation-adjusted dollars). By 2022, this segment had contracted to 39.1%.

While popular narratives often frame this as a slide into poverty, demographic data reveals a different trajectory: the share of households earning $100,000 or more nearly tripled, rising from 13.1% to 37.5%. This created a massive, highly liquid upper-middle class with significant capital to deploy into financial markets.
The Post-Financial Crisis Era (2010–2019)
Following the 2008 financial crisis, a prolonged period of ultra-low interest rates and quantitative easing inflated asset values. During this decade, automatic enrollment in employer-sponsored 401(k) plans and target-date funds quietly brought millions of lower- and middle-income workers into the equity market by default, establishing a steady, non-discretionary bid for index funds.
The Pandemic and Inflationary Shock (2020–2022)
The massive fiscal stimulus of the pandemic era temporarily bolstered household balance sheets across all income brackets. However, the subsequent inflationary wave—which saw consumer prices rise by approximately 26% from late 2019 through the mid-2020s—rapidly eroded these cash buffers for the bottom 50% of earners. To combat this inflation, the Federal Reserve embarked on one of its most aggressive interest rate hike campaigns in history, pushing risk-free yields above 5%.
The Great Cash Hoard and Rotation (2023–2024)
As interest rates peaked, retail and institutional investors fled risk assets in favor of high-yielding money market funds, building a historic multi-trillion-dollar cash hoard. By mid-2024, as inflation showed signs of cooling and expectations of interest rate cuts began to circulate, this "dry powder" began rotating back into the equity market, igniting a powerful, momentum-driven melt-up.

The Mid-Year Policy Pivot
The assumption of perpetual liquidity faced a sudden challenge mid-year when monetary policy took a unexpectedly hawkish turn. In a crucial policy meeting, the Federal Reserve adopted a highly restrictive stance, removing easing biases and indicating that persistent inflation could warrant further rate hikes. This policy shift created an immediate friction point for a market heavily reliant on cheap leverage and momentum.
3. Supporting Data: Unveiling the Capital Engines
The record-breaking inflows observed in global markets are driven by five distinct capital engines. Analyzing the data behind these engines reveals where the money is coming from—and where it is not.
┌──────────────────────────────────────────────────────────────────────────┐
│                      THE FIVE ENGINES OF MARKET LIQUIDITY                │
├──────────────────────────────────┬───────────────────────────────────────┤
│ 1. Money Market Hoards           │ $7.92 Trillion total ($3.09T Retail)  │
├──────────────────────────────────┼───────────────────────────────────────┤
│ 2. Concentrated Wealth (Top 10%) │ $50 Trillion in equities (8% in cash) │
├──────────────────────────────────┼───────────────────────────────────────┤
│ 3. Corporate Buybacks            │ $926 Billion YTD (42% Tech/IT)        │
├──────────────────────────────────┼───────────────────────────────────────┤
│ 4. Passive Default Inflows       │ Bottom 50% equity up 571% since 2010  │
├──────────────────────────────────┼───────────────────────────────────────┤
│ 5. Leveraged Speculation         │ $218B Leveraged ETFs; $7B/day Options │
└──────────────────────────────────┴───────────────────────────────────────┘
Engine 1: Money Market Fund Balances
The pool of sidelined capital remains exceptionally deep. As of mid-year, assets in money market funds reached an unprecedented $7.92 trillion. Within this total, retail investors account for $3.09 trillion—a record high.
Even a marginal reallocation of this cash back into equities, triggered by declining yields or fear of missing out (FOMO), represents hundreds of billions of dollars in automatic buying pressure.

Engine 2: The Wealth Buffer of the Top 10%
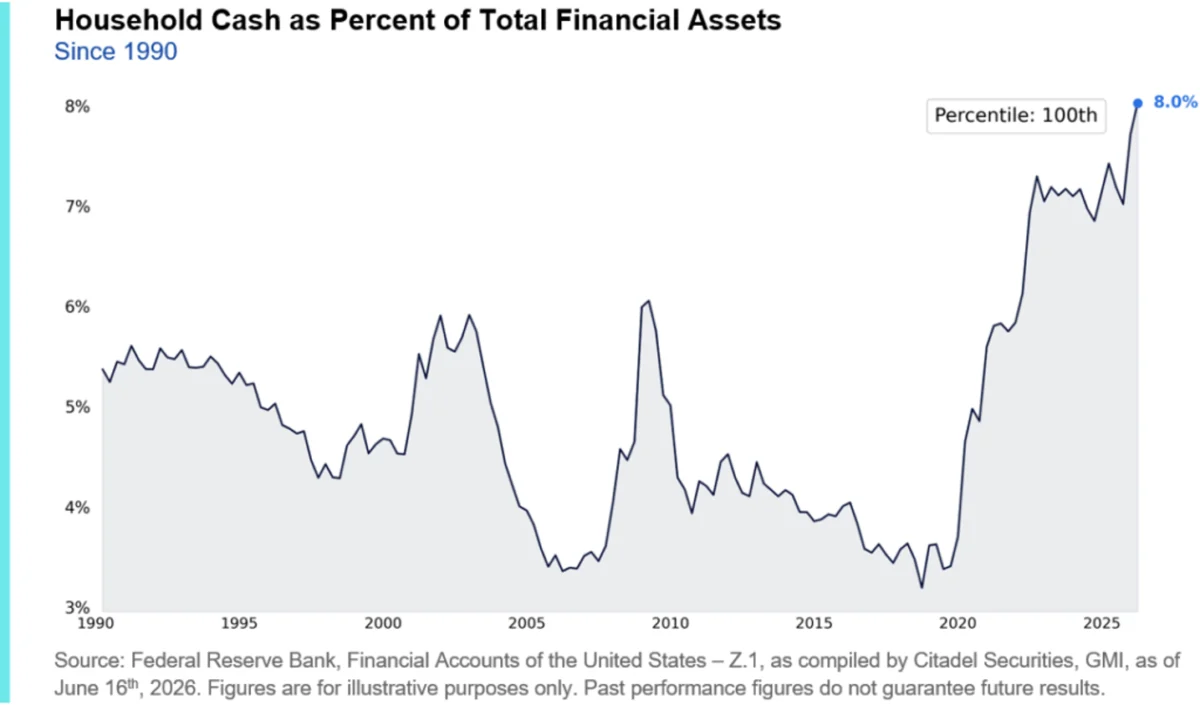
The top 10% of households own roughly $50 trillion in equities and mutual funds, representing approximately 87% of all privately held stock market wealth. Crucially, this cohort’s cash-as-a-share-of-assets ratio has hovered near 8%—its highest level since 1990.
Because this group’s daily consumption is entirely decoupled from their investment decisions, they possess the discretionary firepower to aggressively buy market dips, regardless of broader economic headwinds.
Engine 3: Corporate Buybacks
The single largest and most price-insensitive buyer in the market is Corporate America itself. Year-to-date buyback authorizations across the S&P 500 reached a historic $926 billion, with the information technology sector accounting for 42% of that total. These corporate repurchases provide a constant, mechanical bid for shares, independent of consumer sentiment or macroeconomic indicators.
Engine 4: Passive Default Inflows
While the bottom 50% of households own just 1.1% of the total equity market pie, their collective holdings have grown by 571% since 2010, reaching $617 billion.

This growth does not reflect active trading on retail brokerage platforms; rather, it is the result of automated, non-discretionary retirement contributions. Every pay period, a fixed portion of the working class’s income is automatically funneled into target-date funds and index trackers, creating a structural floor for the market.
Engine 5: Leveraged Speculation and Options Premium
A significant portion of the capital driving index gains is not fully funded cash, but rather amplified exposure via derivatives:
- Leveraged ETFs: Assets in leveraged long ETFs hit a record $218 billion, with over two-thirds concentrated in technology and semiconductor sectors.
- Retail Options: Daily retail options premium volume reached an all-time high of approximately $7 billion.
- Notional Expirations: System-wide derivative expirations, such as quarterly "quadruple witching" events, have carried up to $8.3 trillion in notional value, dramatically increasing intra-day volatility and mechanical hedging flows by market makers.
4. Official Responses, Debates, and Perspectives
The friction between struggling households and thriving financial markets has sparked fierce debate among public commentators, financial institutions, and policymakers.
The Cultural Debate: Structural Squeeze vs. Personal Responsibility
The cultural divide was recently highlighted by a viral online debate centered on comments from media personality Kevin O’Leary, who criticized younger workers for financial irresponsibility, pointing to expenditures like "$28 lunches."

The public backlash was swift and data-driven. Critics pointed out that while individual budgeting is important, no amount of personal frugality can bridge the structural gap created by a housing market where prices have outpaced median incomes by a wide margin, alongside a 26% cumulative increase in basic living costs.
The Institutional Assessment: Fragility on Main Street
Prominent research firms and consumer surveys confirm that financial distress at the bottom of the K-bracket is highly measurable:
- Bankrate’s Annual Survey: Found that only 47% of Americans possess sufficient liquidity to cover an unexpected $1,000 expense, with the remainder forced to rely on credit cards, family loans, or asset liquidation.
- U.S. News Consumer Report: Indicated that the median household emergency fund fell to $5,000—representing a 50% drop from the prior year—as high inflation forced families to draw down their pandemic-era savings.
The Policy Pivot: A Hawkish Federal Reserve
The monetary environment that allowed this liquidity-driven market to thrive is facing new pressure. Following a crucial mid-year policy meeting, the Federal Reserve delivered a stark message. The post-meeting statement was exceptionally brief, completely omitting any previous mentions of an easing bias. Furthermore, half of the participating officials signaled the likelihood of at least one additional interest rate hike.
This hawkish shift represents a direct challenge to the highly leveraged momentum strategies currently dominating Wall Street, signaling that the central bank remains committed to cooling asset bubbles if they threaten to reignite inflation.

5. Implications: Market Fragility and Investor Strategy
The divergence between a strained real economy and a cash-rich financial market has profound implications for risk management, index stability, and portfolio positioning.
┌──────────────────────────────────────────────────────────────────────────┐
│                      SYSTEMIC RISKS & PORTFOLIO IMPLICATIONS             │
├──────────────────────┬───────────────────────────────────────────────────┤
│ Risk Factor          │ Market Impact                                     │
├──────────────────────┼───────────────────────────────────────────────────┤
│ Sector Concentration │ Semiconductors comprise 18.8% of S&P 500;         │
│                      │ exceeding the 2000 dot-com bubble peak.           │
├──────────────────────┼───────────────────────────────────────────────────┤
│ Leverage Reversal    │ $218B in leveraged ETFs acts as an accelerator    │
│                      │ on the downside if market momentum shifts.        │
├──────────────────────┼───────────────────────────────────────────────────┤
│ Monetary Friction    │ High-for-longer interest rates pressure highly     │
│                      │ indebted consumers and speculative corporate debt.│
└──────────────────────┴───────────────────────────────────────────────────┘
Extreme Sector Concentration
The flood of passive inflows and speculative retail capital has created historic concentration risks within the benchmark indexes. Semiconductors and related hardware manufacturers now make up 18.8% of the entire S&P 500. This exceeds the concentration level of any single sector during the height of the 2000 dot-com bubble.
When nearly a fifth of a broad market index is tied to a single highly cyclical industry, the index ceases to function as a diversified economic indicator. Instead, it becomes a concentrated bet on a handful of mega-cap technology firms, where a single disappointing earnings report can trigger broad-based market declines.
The Double-Edged Sword of Leverage
The record-breaking retail inflows into leveraged ETFs and short-dated options have acted as a powerful accelerant on the way up, forcing market makers to buy underlying equities to hedge their exposures.

However, this mechanical relationship operates in reverse. If a macroeconomic shock or a hawkish monetary surprise triggers a sustained sell-off, the rapid unwinding of these leveraged positions will amplify downward momentum, transforming a standard market correction into a highly volatile liquidity event.
Strategic Recommendations for Investors
In a market driven by liquidity rather than fundamental economic health, traditional valuation metrics can remain distorted for extended periods. To navigate this late-cycle environment, wealth managers recommend several tactical adjustments:
- Implement Systematic Rebalancing: Investors should regularly harvest profits from hyper-concentrated technology holdings and reallocate capital to under-owned, cash-generating sectors such as defensive value, infrastructure, and high-quality short-duration debt.
- Maintain Cash Reserves: With money market funds still yielding attractive risk-free rates, holding a robust cash buffer serves a dual purpose: it provides a stable yield while ensuring immediate liquidity to purchase high-quality assets during a market correction.
- Avoid Chasing Leveraged Products: Speculative retail instruments, such as 3x leveraged sector ETFs and short-dated out-of-the-money options, carry severe decay risks and are highly vulnerable to sudden shifts in market regime.
- Focus on Balance Sheet Strength: When selecting individual equities, prioritize companies with low debt-to-equity ratios, strong free cash flow generation, and active, self-funded share repurchase programs. These businesses are best positioned to withstand both sustained high borrowing costs and consumer-led economic slowdowns.
Ultimately, the record retail inflows do not signal a robust, universally healthy economy. They reflect a highly concentrated pool of capital seeking performance in a polarized financial system. For the disciplined investor, this environment requires a clear-eyed distinction between price momentum and structural reality, recognizing that the most critical phase of the market cycle is not when liquidity peaks, but when it begins to recede.
