
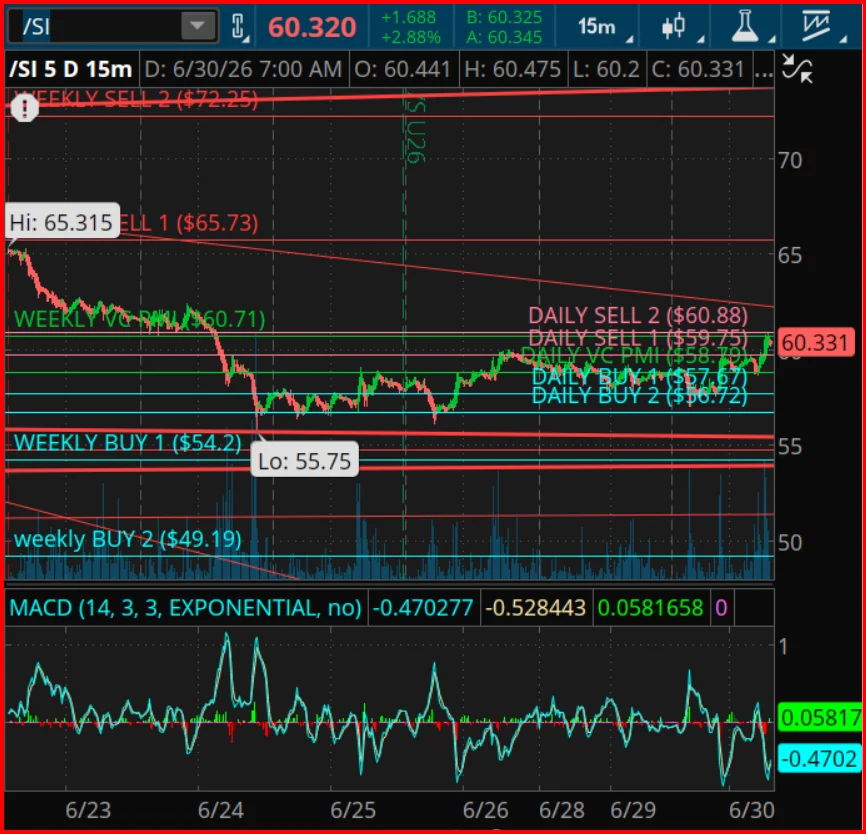
The global precious metals landscape is currently witnessing a fascinating consolidation phase in silver futures. Following a sharp, high-velocity corrective decline that saw prices plummet from a June 22 peak of 65.31 to a June 24 trough of 55.75, the market has demonstrated remarkable resilience. As of the latest sessions, silver has stabilized, trading near the 60.33 mark. This movement is not merely random fluctuation; it represents a calculated transition from a liquidity-driven correction into a structured consolidation phase, governed by statistical mean-reversion dynamics.
Chronology of the Recent Correction
The volatility witnessed over the final week of June served as a "stress test" for the silver market. The rapid descent from the 65.31 resistance level to the 55.75 support zone triggered a wave of algorithmic and retail liquidation. However, the speed of the recovery—pulling back toward the Weekly Variable Changing Price Momentum Indicator (VC PMI) mean of 60.71—suggests that institutional buyers have been aggressively accumulating positions at these statistically discounted levels.
The market’s ability to recover nearly 5 points in under 48 hours indicates that the fundamental bid for silver remains robust. Traders who observed the dip to 55.75 identified it as a classic "oversold" condition, leading to the current stabilization near the 60.33 equilibrium point. This price action confirms that the market is currently searching for a new floor, transitioning from the panic-selling phase into a disciplined accumulation phase.
Supporting Data: Quantitative Technical Framework
To understand the current positioning of silver, one must look toward the VC PMI—a quantitative mean-reversion methodology that identifies statistically significant price levels. According to the latest readings, the Daily Mean Price sits at 58.79.
Daily Technical Landscape
The current market structure provides clear demarcations for intraday traders:
- Support Levels: Daily Buy 1 is identified at 57.67, with a secondary support (Buy 2) at 56.72. These levels represent the "dip-buying" zones where probabilities favor a reversal to the upside.
- Resistance Levels: Daily Sell 1 is located at 59.75, with a critical Sell 2 resistance at 60.88.
As silver tests the 60.88 threshold, it enters an "extreme" territory. In quantitative trading, entering an extreme zone implies that the price has deviated far enough from the mean that the probability of a temporary reversal or a pause increases significantly. Consequently, the VC PMI suggests that long-position holders should consider taking partial profits at these levels rather than blindly adding to positions.
Weekly Outlook and Pivot Points
On the weekly timeframe, the primary pivot remains anchored at 60.71. This is the "North Star" for current market sentiment.

- Bullish Confirmation: A sustained weekly close above 60.71 would signal a renewed bullish momentum. Should this occur, the market is projected to target the Weekly Sell 1 level at 65.73, with a further extension toward the Weekly Sell 2 target of 72.25.
- Bearish Risks: Conversely, should the market fail to hold the weekly mean of 60.71, a retrace toward the Weekly Buy 1 level at 54.20 becomes the likely path. This zone represents a high-probability accumulation area for long-term investors. A failure to hold 54.20 would further increase the statistical probability of testing the 49.19 floor.
The Harmonic Convergence: Long-Term Cycle Analysis
Beyond the intraday and weekly fluctuations, the broader structural outlook for silver is exceptionally compelling. Current cycle analysis indicates that silver is currently positioned within a critical 180-day cycle window.
More importantly, the market is approaching a rare "harmonic alignment." The convergence of the 270-day seasonal cycle, the 360-day annual cycle, and the powerful 9-year cycle is projected to peak in the second half of 2026. Historically, these harmonic alignments act as precursors to major trend reversals followed by extended, secular advances.
The Gann Perspective
Using W.D. Gann’s "Square of 9"—a mathematical tool used to identify time and price relationships—the recent June correction fits the profile of a "normal geometric retracement" within a secular bull market. The Square of 9 suggests that as long as silver maintains its position above major cycle support zones, the primary bullish trajectory remains intact. A decisive, high-volume close above the 60.88 level would essentially confirm that the correction bottomed at 55.75, clearing the runway for the next major leg of the rally.
Momentum Indicators and Market Psychology
The technical picture is further bolstered by a shift in momentum oscillators. The Moving Average Convergence Divergence (MACD) has recently crossed back above its signal line. This, paired with the formation of a series of higher lows on the daily chart, indicates that the "liquidation fatigue" is over. Buying pressure is gradually returning as market participants regain confidence in the underlying value of the metal.
The transition from a liquidation phase to a consolidation phase is often the most difficult period for retail traders to navigate. However, the current price action suggests that the "weak hands" have been shaken out, leaving a more stable foundation for the next move higher.
Implications for Investors and Market Participants
The current silver market environment presents a nuanced set of implications for different classes of investors.
For Short-Term Traders
The current proximity to the Daily Sell 2 (60.88) suggests a period of caution. The quantitative evidence advises against chasing the price at these levels. Instead, the strategy should be to secure partial profits on existing long positions and wait for a clear, confirmed breakout above the 60.88 resistance. Alternatively, traders looking for entry points should watch for a pullback toward the daily mean (58.79) to minimize risk.

For Long-Term Strategic Investors
The long-term cycle alignment suggests that the second half of 2026 could represent a pivotal moment for silver. For those with a multi-year time horizon, the current volatility is largely "noise" within a broader, upward-sloping trend. The accumulation zones identified by the VC PMI (particularly the 54.20 level) should be viewed as strategic opportunities to add to positions, rather than signs of a structural breakdown.
Risk Management Protocols
It is imperative to note that the quantitative models discussed—including the VC PMI and Gann’s Square of 9—are probabilistic frameworks, not guarantees. The precious metals market is subject to exogenous shocks, including geopolitical instability, shifting interest rate expectations from the Federal Reserve, and changes in industrial demand for silver.
Investors are urged to maintain strict risk management protocols. No position should be sized such that a move to the next support level—or beyond—jeopardizes the overall health of an investment portfolio. Utilizing stop-loss orders anchored to the VC PMI support levels is a prudent way to mitigate downside risk while allowing the market to "breathe" within its identified volatility parameters.
Conclusion: Preparing for the Next Phase
Silver has successfully navigated the turbulence of June, transitioning from a sharp correction into a stable, constructive consolidation. With momentum indicators turning positive and a powerful harmonic cycle alignment on the horizon, the path of least resistance appears to be trending upward. However, the next few sessions will be critical. A sustained close above the 60.88 resistance level is the key trigger needed to unlock the next phase of the bull market.
As the market continues to reconcile these technical factors, participants should remain disciplined. By focusing on the intersection of quantitative mean-reversion levels and long-term cycle windows, investors can position themselves to benefit from the volatility rather than being consumed by it. In the high-stakes world of futures trading, precision, patience, and a reliance on proven mathematical methodologies remain the most effective tools for achieving consistent long-term success.
Disclaimer: The VC PMI (Variable Changing Price Momentum Indicator) is a quantitative mean-reversion methodology that identifies statistically significant price levels where probabilities favor reversals toward equilibrium. Trading futures, options, ETFs, and leveraged instruments involves substantial risk and is not suitable for all investors. Market analysis based on VC PMI, Gann Square of 9, cycle analysis, and other technical methodologies represents probabilistic models rather than guarantees of future performance. Always employ prudent risk management and consult a licensed financial advisor before making investment decisions.
