
Main Facts: The Sudden Realignment of Economic Growth Projections
The Federal Reserve Bank of Atlanta’s GDPNow forecasting model has experienced a dramatic downward revision, catching many market observers by surprise. Within a critical three-day window between June 24 and June 26, the real-time tracker of U.S. economic growth plummeted from an optimistic 3.1% down to a modest 1.2%. Though the underlying data shifts occurred in late June, the finalized tracking results have only recently been compiled and published, shedding light on a stark divergence in the underlying health of the U.S. economy.
The sharp decline in the Gross Domestic Product (GDP) growth projection is primarily attributed to two macroeconomic developments: a significant downward revision in consumer spending data by the Bureau of Economic Analysis (BEA) and a massive, unexpected expansion of the U.S. international trade deficit.
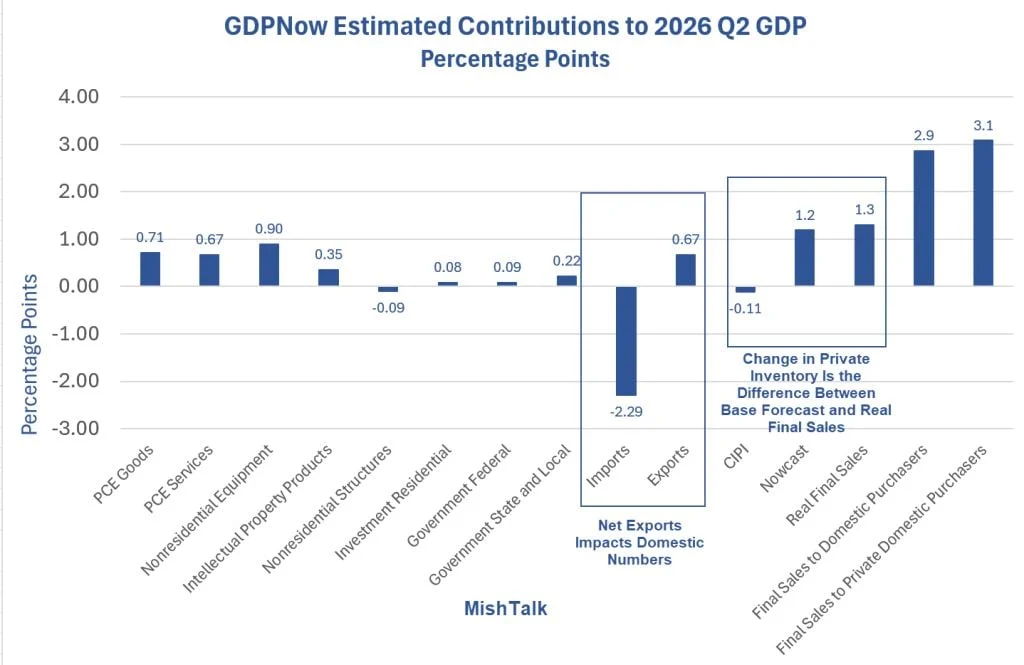
While a headline GDP growth forecast of 1.2% signals a rapidly cooling economy, the internal components of the report paint a highly nuanced picture. The bottom-line estimate for the domestic economy, represented by Real Final Sales, stands at a muted 1.3%. Conversely, Real Final Private Domestic Sales—a metric that strips out volatile government spending, inventories, and international trade—remains remarkably robust at 3.1%. This divergence presents a complex challenge for policymakers at the Federal Reserve, who must balance signs of domestic resilience against broader indicators of a slowing global trade footprint and persistent inflationary pressures.
GDPNow Q2 Forecast Evolution (Late June)
======================================================
June 24 Forecast:                  3.1%
June 25 (After PCE Revisions):      2.5%
June 26 (After Trade Data):         1.2%
Total Plunge:                      -1.9 percentage points
Chronology: Three Days of Volatility in the Nowcast
The dramatic adjustment to the GDPNow model unfolded over a tight timeline, driven by consecutive releases of backward-looking economic revisions and fresh monthly indicators.
                  [ June 24 ] -> GDPNow stands at 3.1%
                       │
                       ▼
                  [ June 25 ] -> BEA revises Q1 & April PCE
                       │         GDPNow drops to 2.5% (-0.6 pp)
                       │         (PCE drag: -0.5 pp)
                       ▼
                  [ June 26 ] -> Advance Economic Indicators released
                       │         Trade deficit widens by 27.4%
                       │         GDPNow plunges to 1.2% (-1.3 pp)
                       ▼
                  [ July 1  ] -> Model updates finalized and published
June 24: The High Baseline
Prior to the revisions, the GDPNow model projected a robust second-quarter annualized growth rate of over 3%. This estimate assumed that consumer spending would hold steady and that net exports would not act as an overwhelming drag on output.
June 25: The Consumer Spending Downgrade
The first major blow to the forecast came when the BEA released revised figures for first-quarter GDP and April Personal Consumption Expenditures (PCE). The revisions revealed that consumer momentum was weaker than previously estimated. Consequently, the GDPNow forecast was revised downward to approximately 2.5%, with nearly the entirety of the downgrade concentrated in consumer spending.
June 26: The International Trade Shock
The coup de grâce occurred the following morning with the release of the U.S. Census Bureau’s Advance Economic Indicators report for May. The data revealed a massive 27.4% surge in the international trade deficit in goods. The GDPNow model immediately factored this into its net exports calculation, slashing the headline projection by more than a full percentage point to its current resting place of 1.2%.

July 1: Finalization and Market Reflection
The Atlanta Fed finalized and published the tracking results, confirming that the model’s estimate for net exports remained deeply negative at -1.62 percentage points, cementing the 1.2% headline projection as the market headed into July.
Supporting Data: Deconstructing the Drag Components
To understand how a 3.1% growth projection evaporated so quickly, one must examine the specific contributions of the GDP components: Personal Consumption Expenditures (PCE), Net Exports, and Private Domestic Investment.
The PCE Contribution Drop (-0.5 Percentage Points)
According to analysis provided by the Atlanta Fed, revisions to historical data altered the trajectory of consumer spending. The contribution of PCE to the overall GDPNow forecast fell by 0.5 percentage points. This drag was divided into two main categories:
- Goods (-0.3 percentage points): This reduction was almost entirely driven by a single retroactive adjustment. The BEA revised April’s real "Net Purchases of Used Motor Vehicles" downward by a massive 9.3% (non-annualized) compared to the data published a month prior.
- Services (-0.2 percentage points): The model’s forecast for real services PCE growth was lowered from 1.9% to 1.4%. This adjustment followed the BEA’s decision to slash annualized Q1 real PCE services growth from an initial estimate of 1.8% down to just 0.5%, alongside minor downward revisions to March and April growth rates.
The Net Exports Collapse (-1.03 Percentage Points)
The most severe damage to the Q2 forecast came from the international trade sector. Net exports are calculated as exports minus imports; when imports rise significantly faster than exports, it acts as a direct mathematical drag on GDP.
- On June 25, the GDPNow model estimated that net exports would subtract 0.59 percentage points from Q2 growth.
- On June 26, following the Advance Economic Indicators release, this drag ballooned to 1.62 percentage points—a net negative swing of 1.03 percentage points.
- The driver of this shift was a 27.4% widening of the goods trade deficit in May, as import volumes surged while export growth remained stagnant.
Net Exports Contribution to Q2 GDP
======================================================
June 25 Estimate:                 -0.59 pp
June 26 Estimate:                 -1.62 pp
------------------------------------------------------
Net Change:                       -1.03 pp (Drag on GDP)
Gross Private Domestic Investment (-0.13 Percentage Points)
Private investment also saw a modest decline on June 26, with its projected contribution falling from 1.48 percentage points to 1.35 percentage points. This minor reduction accounted for the remainder of the overall forecast decline, reflecting a slight cooling in business inventory accumulation and equipment investment.
Official Responses: Inside the Atlanta Fed’s Modeling
To clarify the mechanics behind these rapid adjustments, financial analyst Mike Shedlock ("Mish") initiated an email exchange with Pat Higgins, the creator and lead economist behind the Atlanta Fed’s GDPNow forecasting model.
When asked to parse the key reasons for the June 25 downgrade, Higgins provided a detailed breakdown of the BEA’s revisions:

"Essentially all of the decline in the change in GDPNow’s forecast… was concentrated in personal consumption expenditures (PCE), whose forecasted contribution to GDP growth fell 0.5 percentage points… About 0.3 percentage points of the forecast decline in the PCE contribution to growth was concentrated in goods while the remaining 0.2 percentage points was concentrated in services."
Higgins highlighted the outsized role of the used car market revision, noting that the non-annualized 9.3 percentage point downward revision to April’s real "Net Purchases of Used Motor Vehicles" explained the bulk of the goods downgrade.
Regarding services, Higgins explained that the model had to adjust to a major historical rewrite:
"The BEA revised annualized Q1 real PCE services growth from 1.8% to 0.5% today and there was a modest downward revision to the April/March growth rate as well… The downward revision to the monthly growth rates—if you keep the May and June growth forecasts fixed—would imply a 0.5 percentage point reduction in the model’s forecast for PCE services."
Higgins noted that while the GDPNow model attempts to anticipate revisions using high-frequency retail sales and international trade data, it assumes no revision for the majority of the services basket by construction. Consequently, retroactive downward revisions through April directly dragged down the model’s forward-looking services projection.
Macroeconomic and Political Implications
The sudden drop in the GDPNow forecast highlights a growing divide in how analysts and policymakers interpret the health of the U.S. economy. Depending on which metric an observer highlights, the economic outlook can appear either highly resilient or rapidly deteriorating.
Selected Economic Performance Metrics
======================================================
Headline GDPNow Forecast:         1.2% (Appears Weak)
Real Final Sales:                 1.3% (Muted Bottom Line)
Real Final Private Domestic Sales: 3.1% (Strong Domestic Core)
The Federal Reserve’s Policy Dilemma
For the Federal Reserve, the headline GDP projection of 1.2% might suggest an economy that is successfully cooling under the weight of restrictive monetary policy. However, the Fed historically places far more weight on Real Final Private Domestic Sales, which stripped of trade and inventory volatility, sits at a robust 3.1%.

This domestic strength suggests that consumer demand and business investment are not yet buckling. With core inflation remaining sticky, a 3.1% private domestic sales rate gives the Fed little reason to rush into rate cuts. In fact, as of late June, interest rate futures markets were pricing in a 70.4% to 73.4% probability of at least one more Federal Reserve rate hike before the upcoming presidential election.
Political Fallout and Tariff-Related Inflation
The timing of these economic reports introduces significant political volatility. The Biden administration had previously highlighted narrowing trade deficits in April as a sign of manufacturing strength. The sudden 27.4% surge in the trade deficit in May, however, has met with silence from official channels.
Additionally, if the Federal Reserve feels compelled to raise interest rates close to an election, it will likely draw sharp criticism from political campaigns. Former President Donald Trump has previously criticized pre-election rate hikes, suggesting they politically disadvantage challengers.
At the same time, the sudden widening of the trade deficit shines a spotlight on supply chain dynamics. Importers may be front-running anticipated tariff increases by accelerating shipments of foreign goods, a practice that temporarily spikes the trade deficit and introduces tariff-related inflationary pressures into the domestic supply chain.
With the upcoming jobs report and subsequent inflation prints expected to show continued volatility, the GDPNow model proves that the U.S. economy is far from being on autopilot. Whether the final Q2 numbers land closer to the headline 1.2% or the domestic-driven 3.1% will dictate the Fed’s next move in an increasingly charged political environment.
