
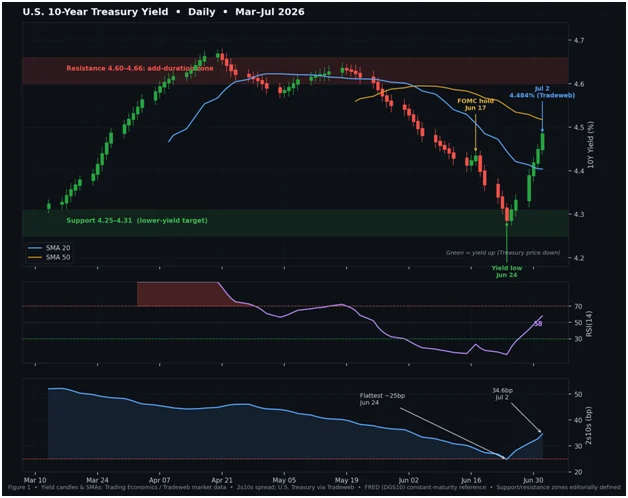
The U.S. fixed-income market is currently navigating a period of profound ambiguity, characterized by a 10-year Treasury yield that refuses to break free from its established technical constraints. As of the market close on Thursday, July 2, the 10-year yield stood at 4.484%, according to Tradeweb data. This figure places the benchmark squarely in the middle of a well-defined, albeit frustrating, trading band.
For institutional investors and retail traders alike, the current environment is defined by a singular, overarching theme: the disconnect between the market’s aggressive pricing of Federal Reserve rate hikes and the underlying macroeconomic data, which suggests a cooling economy. This "range-bound" phenomenon is not merely a technicality; it is a structural representation of a market that is waiting for a catalyst—either a definitive signal of inflationary resurgence or a clear admission of economic deceleration from the Federal Reserve.
The Core Data: A Snapshot of Stagnation
The current yield environment, while stable on the surface, is underpinned by a complex web of contradictory data points. The most notable of these is the June payroll report. The Bureau of Labor Statistics (BLS) revealed a meager gain of 57,000 jobs—nearly half of the consensus estimate of 110,000. Furthermore, downward revisions for April and May, totaling 74,000 jobs, have added weight to the argument that the labor market is losing steam.
Despite this, the unemployment rate sits at 4.2%, and the participation rate has slipped to 61.5%. Simultaneously, the Federal Reserve remains in a state of "unanimous hold," keeping the Fed Funds rate in the 3.50%–3.75% range. The divergence is captured perfectly in the CME’s FedWatch data, which shows September hike probabilities oscillating near 54.8%, down from 64.3% just a week prior.
This state of limbo is exactly why analysts, such as those at TD Securities, have established a near-term yield range of 4.25% to 4.66%. The market is effectively pricing in a "maybe" regarding future hikes, creating a ceiling for yields that prevents a breakout, while persistent inflation fears prevent a decisive downward move.
A Chronological Analysis of Recent Price Action
The trajectory of the 10-year yield over the last month reveals a market caught in a rhythmic cycle of compression and release.
Late June: The Search for Support
Leading up to June 24, the market experienced a period of intense compression. During this time, the 10-year yield pushed toward the 4.28% area. This movement coincided with the flattest reading on the two-to-10-year yield curve, with the spread narrowing to approximately 25 basis points. This was a clear signal of market participants betting on a "soft landing" or an imminent pivot.
The Early July Rebound
Following the June 24 lows, the market did not break through the floor. Instead, it experienced an orderly recovery. The yield climbed back toward the 4.48%–4.50% range, reclaiming lost ground without triggering a panic. This move highlights the resilience of the current range; when yields move toward the lower end (4.25%–4.31%), buyers perceive high value in Treasury prices, prompting a reversal.
The Current Standoff
As of the start of July, the market is essentially consolidating. The RSI (14) sits near 58, a neutral mid-range indicator that suggests neither overbought nor oversold conditions. The 20-day Simple Moving Average (SMA) remains below the 50-day SMA, confirming that while the rebound has been orderly, it has yet to signal the start of a new, long-term trend.
Supporting Data: Why the Range Holds
The persistence of the 4.25%–4.66% range is supported by several structural pillars.
The Labor-Inflation Paradox
The Federal Reserve finds itself in a precarious position. While payroll growth is slowing, Core PCE—the Fed’s preferred measure of inflation—remains elevated at 3.4% as of May, the highest level since October 2023. This creates a "sticky" inflation narrative that keeps the Fed hawkish in its rhetoric, even if the data justifies a more dovish stance.

The Curve Dynamics
The two-to-10-year spread, which widened from 25 basis points on June 24 to 34.6 basis points on Thursday, provides a crucial clue. While the curve is still technically inverted or "flat" in a historical context, the recent tactical steepening indicates that traders are unwinding previous, highly crowded bets on a total yield curve inversion. This tactical churn keeps the 10-year yield from moving in a singular, vertical direction.
The Role of Term Premium
The potential for a higher term premium remains a "wildcard." If fiscal concerns mount or if the market begins to demand higher compensation for holding long-term debt, the 10-year yield could test the upper resistance of 4.66% regardless of what the Fed does with the front end.
Official Perspectives: The Fed’s Balancing Act
The rhetoric from Fed officials has been a masterclass in ambiguity. Fed Chair Kevin Warsh, speaking recently at the ECB Forum, provided a nuanced perspective that effectively mirrored the current market hesitation.
Warsh acknowledged that inflation risks have shown signs of easing over the past month. This was a signal to the dovish camp that the Fed is not blind to the cooling labor data. However, he simultaneously reaffirmed the Fed’s absolute commitment to the 2% inflation target. This duality is intentional; it allows the Fed to keep the threat of a hike "on the table" without having to commit to one, thereby keeping the long end of the Treasury market anchored in a state of watchful waiting.
Strategic Implications: How to Play the Range
For investors, the current environment demands a disciplined, tactical approach rather than a "set and forget" strategy. The asymmetry of the setup is the key to managing risk.
The Case for Buying the Spike
The most prudent strategy, according to current market analysis, is to treat yield spikes as buying opportunities. When the 10-year yield approaches the upper resistance band of 4.60%–4.66%, Treasury prices are at their most attractive relative to the range.
- Entry Strategy: Increase duration exposure when yields hit the 4.60%–4.66% band. This is where the market is essentially pricing in the maximum "hawkish" scenario, providing a buffer for those who believe the Fed will ultimately hold.
- Exit/Reduction Strategy: Reduce exposure or take profits as yields approach the 4.25%–4.31% floor. At this level, the market has already priced in a significant amount of easing, and the potential for a "bullish" breakout is capped by the persistent inflation data.
The Risk of Invalidation
No strategy is without risk. The "Range-Bound" framework holds only as long as the fundamental data remains within current parameters. Investors must watch for two key triggers that would invalidate this strategy:
- The Upside Breakout: A sustained daily close above 4.66% would signal that the market has abandoned the "unrealized hike" narrative and is instead moving toward pricing in a sustained, long-term high-rate environment.
- The Downside Breakout: A decisive break below 4.25% would indicate that growth concerns have finally overwhelmed the inflation narrative, signaling a recessionary pivot that would fundamentally shift the bond market’s trajectory.
Conclusion: Discipline in the Face of Uncertainty
The 10-year Treasury is currently a prisoner of its own range. It is caught between a labor market that suggests the economy is cooling and an inflation print that mandates continued vigilance from the central bank. As we move through the second half of the year, investors should resist the urge to chase tactical moves and instead focus on the extremes.
The market is telling us that it is not yet ready to commit to a new trend. Until the Federal Reserve provides a definitive shift in policy or the incoming economic data provides a clear directional signal, the strategy remains clear: fade the extremes, honor the range, and maintain the discipline to add duration when the market is at its most pessimistic and reduce it when it is at its most optimistic. The 4.60%–4.66% level remains the most important zone for any serious duration-focused investor in the current cycle.
Disclaimer: This article is for informational purposes only and does not constitute investment advice, a recommendation, or an offer to buy or sell any security. Treasury yields, spreads, and policy expectations change continuously and may differ from the levels cited, which reflect data available as of the U.S. market close on Thursday, July 2, 2026. Forward-looking statements are probabilistic and subject to revision. Readers should conduct their own research and consult a licensed financial professional before making investment decisions.
