
The global financial markets are once again locked in a heated debate over the trajectory of inflation and the future of monetary policy. Following the release of the May consumer price index (CPI) print, which came in at a startling 4.2% year-over-year—the highest reading since April 2023—market anxieties have spiked. In response, the 10-year U.S. Treasury yield surged past 4.6% before experiencing a moderate retracement.
Prominent market commentators and macroeconomic bears, often referred to as the "doom crowd," have quickly seized upon these figures. They warn of a structural return to the stagflationary environment of 1979, characterized by runaway prices, imminent interest rate hikes, and a central bank cornered by geopolitical volatility.
However, a deeper look at the underlying data suggests this narrative may be fundamentally flawed. While headline CPI remains highly sensitive to volatile, short-term shocks—such as the recent 23.5% spike in energy costs driven by the conflict in Iran—it is a lagging indicator. To understand where inflation is actually heading, analysts must look to the metric that has consistently led CPI peaks for over four decades: nominal and real wage growth.
1. Main Facts: The Noise of Geopolitics vs. the Signal of Wages
The recent surge in headline inflation to 4.2% has triggered widespread alarm, but a granular breakdown of the data reveals a more concentrated pressure point. The primary catalyst for the May inflation spike was the energy sector, which ran 23.5% higher over the preceding twelve months. Driven by geopolitical tensions and supply disruptions stemming from the Iran war, energy alone accounted for roughly 60% of the monthly all-items CPI gain.

May Inflation & Market Quick-Look:
┌───────────────────────────────┬──────────┐
│ Metric                        │ Value    │
├───────────────────────────────┼──────────┤
│ Headline CPI (YoY)            │ 4.2%     │
│ Energy Sector Growth (YoY)    │ 23.5%    │
│ Energy Contribution to Gain   │ ~60%     │
│ 10-Year Treasury Yield Peak   │ >4.6%    │
│ May Wage Growth (YoY)         │ 3.56%    │
└───────────────────────────────┴──────────┘
While these supply-side shocks dominate headline numbers, they obscure a far more critical macroeconomic development: the structural cooling of the labor market. Wage growth, which peaked fifty months ago in March 2022, has continued its steady downward trajectory. In May, nominal wage growth fell to 3.56% year-over-year—the lowest reading of the current economic cycle.
Historically, wage growth has acted as a highly reliable leading indicator for consumer price inflation. In every economic cycle since 1985, peaks in wage growth have preceded peaks in CPI by a margin of three to seventeen months. Because wage growth has been decelerating monotonically from its March 2022 peak of 7.0%, the current energy-driven CPI spike is highly likely to be a temporary divergence rather than the start of a new, self-sustaining inflationary spiral.
2. Chronology: The Great Post-1985 Structural Inversion
To understand why wage growth leads inflation today, it is necessary to examine how the relationship between labor costs and consumer prices has evolved over the last half-century.
The Pre-1985 Regime: CPI Leads Wages
For decades, mainstream economic theory relied on the traditional Phillips Curve, which posits that tight labor markets naturally push wages up, which in turn drive consumer prices higher in a continuous feedback loop. This model accurately described the dynamics of the 1970s. During this era, inflation expectations were unanchored, and workers routinely demanded "catch-up" pay raises to offset the eroding purchasing power of their paychecks.

- The 1970 Cycle: CPI peaked in February 1970. Nominal wages did not top out until May 1971—a fifteen-month lag.
- The 1974 Oil Shock: Wages and CPI peaked simultaneously, driven by immediate, systemic supply shocks.
- The 1980 Cycle: CPI peaked in March 1980. Wages followed ten months later, peaking in January 1981.
During this period, consumer prices ran first, and wages chased them.
Pre-1985 Cycle (CPI leads Wages):
[CPI Peak] ───(Typically 10-15 Months)───> [Wage Growth Peak]

Post-1985 Cycle (Wages lead CPI):
[Wage Growth Peak] ───(3 to 17 Months)───> [CPI Peak]
The Post-1985 Regime: Wages Lead CPI
In the early 1980s, two structural shifts permanently altered this dynamic:
- The Volcker Shock and Institutional De-unionization: Federal Reserve Chairman Paul Volcker raised the federal funds rate to an unprecedented 19% in 1981, breaking the back of inflation and triggering a deep recession. This aggressive tightening cracked the wage-price spiral. Concurrently, union density collapsed, and Cost-of-Living Adjustment (COLA) clauses largely vanished from employment contracts. At the same time, the forces of globalization began to accelerate, linking the prices of tradeable goods to the global marginal cost of production rather than local labor costs.
- The Anchoring of Inflation Expectations: As the Federal Reserve established long-term policy credibility, households and businesses began to believe that inflation would be held near a 2% target. Consequently, workers stopped pricing aggressive future inflation expectations into their current wage negotiations.
As a result of these shifts, the causal relationship inverted after 1985. Wages ceased to be a reactive, lagging variable. Instead, because tight labor markets signal broad demand pressures before those pressures can be fully passed on to consumer goods and services, wage growth became a powerful forecasting tool.
Post-1985 Cycle Timelines
In every major cycle over the past forty years, the peak in wage growth has consistently signaled the impending peak in consumer prices:

- The 1990 Cycle: Wages peaked in June 1990; CPI peaked four months later in October 1990.
- The 2008 Cycle: Wages peaked in February 2007; CPI did not peak until July 2008—a seventeen-month lead time.
- The Post-GFC Cycle: Wages peaked in May 2010; CPI peaked sixteen months later in September 2011.
- The 2022 Cycle: Wages peaked in March 2022; CPI peaked three months later in June 2022. The shorter lead time in this cycle was primarily due to severe global supply chain bottlenecks, which transmitted goods inflation much faster than the typical wage-to-services transmission channel.
3. Supporting Data: The Power of Real Wage Compression
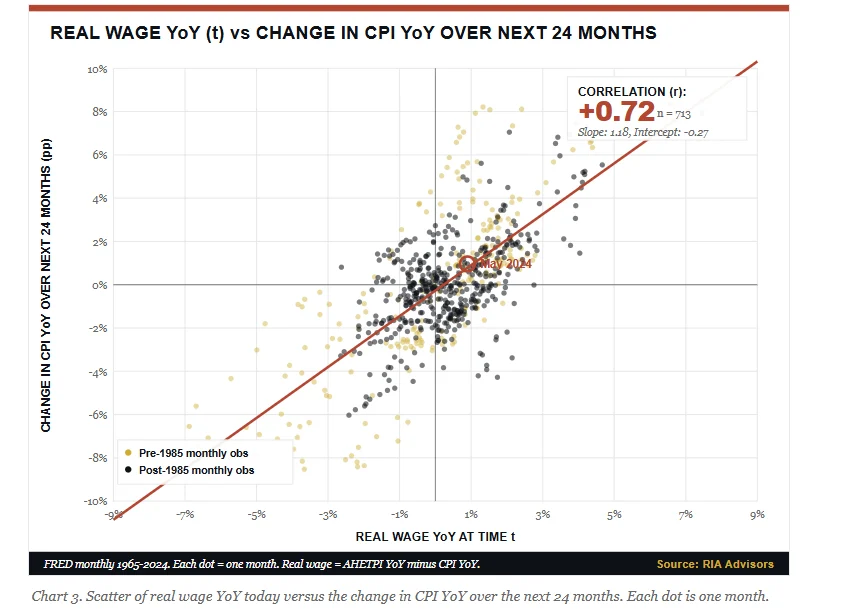
The predictive power of wage dynamics is not merely historical; it is rooted in the mathematical realities of household consumption. The critical transmission mechanism between the labor market and consumer price trends is real wage growth, defined as nominal wage growth minus CPI inflation.
$$textReal Wage Growth = textNominal Wage Growth (AHETPI YoY) – textCPI YoY$$
When nominal wage growth outpaces inflation, real wage growth is positive. Under these conditions, workers experience an increase in purchasing power, allowing them to expand their consumption and provide the demand-side support necessary to sustain higher prices. Conversely, when consumer prices outpace nominal wages, real wage growth turns negative. Under this compression, household budgets contract, consumers reduce discretionary spending, aggregate demand falls, and inflation eventually rolls over.
┌──────────────────────────────────────────────────────────────────┐
│                   REAL WAGE COMPRESSION MECHANISM                │
├──────────────────────────────────────────────────────────────────┤
│                                                                  │
│  Nominal Wages < CPI  ──> Negative Real Wages ──> Demand Decline │
│                                                                  │
│  Demand Decline ──(12 to 24 Month Lag)──> CPI Deceleration       │
│                                                                  │
└──────────────────────────────────────────────────────────────────┘
A statistical analysis of monthly macroeconomic data from January 1965 through May 2024 confirms the strength of this relationship. The correlation between real wage growth in a given month and the subsequent change in CPI over the following twenty-four months is +0.72 across 713 monthly observations. In macroeconomic research, where correlation coefficients above 0.5 are relatively rare, a correlation of 0.72 indicates an exceptionally strong predictive relationship.

Today, this mechanism is once again playing out. Throughout much of 2024, real wage growth hovered in positive territory between +1.0% and +1.5%, supporting steady consumer demand. However, following the recent energy-driven spike in headline CPI, real wage growth has dropped to -0.6%.
While this is not yet the severe 4% real wage contraction witnessed in 1980, or the sharp drop that preceded the demand collapse of 2008, the direction of the trend is clear. Every time real wage growth has crossed into negative territory in the post-1985 era, CPI has subsequently rolled over on a twelve-to-twenty-four-month lag.
4. Market Perspectives: Debating the 1979 vs. 2008 Analogies
The current macroeconomic debate divides market participants into two primary camps: those warning of a return to 1979, and those who see a structural rerun of 2008.
The Bear Case ("The Doom Crowd")
Proponents of the stagflation narrative argue that the May CPI print of 4.2% is the vanguard of a broader inflationary resurgence. To support this view, bears point to potential structural shifts in the global economy, including:

- De-globalization and supply chain near-shoring.
- New labor market restrictions and immigration curbs.
- Broad-based trade tariffs that could permanently raise production costs.
For this bear case to hold true, however, two conditions must be met: nominal wage growth must structurally re-accelerate, and long-term inflation expectations must become unanchored. Currently, there is little empirical support for either condition.
The Atlanta Fed Wage Growth Tracker and the broader Average Hourly Earnings data show that wage growth has trended downward, reaching 3.56% in May. At the same time, long-term inflation expectations remain well-anchored. The 10-year breakeven inflation rate is holding steady near 2.4%, while the Cleveland Fed’s 5-year forward expectation rate is hovering around 2.5%.
Long-Term Inflation Expectations:
┌──────────────────────────────────────┬──────────┐
│ Metric                               │ Rate     │
├──────────────────────────────────────┼──────────┤
│ 10-Year Breakeven Inflation Rate     │ 2.4%     │
│ Cleveland Fed 5-Yr Forward Expect.   │ 2.5%     │
└──────────────────────────────────────┴──────────┘
The 2008 Parallel
Rather than resembling 1979, the current macroeconomic setup shares strong structural similarities with 2008.
In early 2007, U.S. nominal wage growth peaked at approximately 4.1%. The labor market appeared resilient, and the unemployment rate remained below 5%. However, over the subsequent eighteen months, crude oil prices surged from $60 to nearly $147 per barrel. Driven by this massive energy shock, headline CPI spiked to 5.5% by July 2008, sparking widespread warnings of runaway inflation.

Yet, beneath the surface, real wage compression had already been eroding consumer purchasing power for over a year. Because nominal wages were failing to keep pace with soaring energy costs, aggregate demand was quietly fracturing. Once the energy shock ran its course, consumer demand cratered, and within twelve months, headline CPI plunged into negative territory.
While the current economy benefits from stronger bank balance sheets, lower household leverage, and a more resilient labor market than on the eve of the 2008 Global Financial Crisis, the underlying inflation mechanics are remarkably similar: a clear, multi-year peak in wage growth, overlaid with a temporary, energy-driven headline CPI spike.
5. Portfolio and Macroeconomic Implications
This structural framework carries significant implications for asset allocation, risk management, and portfolio strategy over the next twelve to eighteen months.
Asset Allocation Matrix:
┌───────────────────┬─────────────────────────┬─────────────────────────────────┐
│ Asset Class       │ Tactical Stance         │ Core Rationale                  │
├───────────────────┼─────────────────────────┼─────────────────────────────────┤
│ Fixed Income      │ Overweight Duration     │ Yields >4.5% price structural   │
│                   │                         │ inflation; wages signal cooling │
├───────────────────┼─────────────────────────┼─────────────────────────────────┤
│ Equities          │ Quality Compounders /   │ Disinflation supports multiples │
│                   │ Long-Duration Growth    │ while compressing cyclicals     │
├───────────────────┼─────────────────────────┼─────────────────────────────────┤
│ Commodities       │ Underweight / Tactical  │ Geopolitical spikes are temporary │
│                   │                         │ amid slowing consumer demand    │
└───────────────────┴─────────────────────────┴─────────────────────────────────┘
Fixed Income and Duration
The recent sell-off in fixed income, which pushed the 10-year Treasury yield above 4.6%, appears to be overdone. With yields at these levels, the bond market is pricing in a regime of structural, long-term inflation. However, because wage growth is steadily cooling, the underlying drivers of long-term inflation are actually moving in the opposite direction.

This divergence offers an asymmetric risk-reward profile for bond investors. If nominal wage growth continues to decelerate toward its historical baseline, 10-year yields are likely to fall significantly over the coming year, generating strong capital gains for long-duration bondholders. Conversely, if wages do begin to re-accelerate, the monthly data will provide early, clear warnings, allowing investors to adjust their exposure with minimal downside risk.
Equity Market Strategy
In equity markets, a transition toward a wage-led disinflationary environment suggests a shift in leadership:
- Quality Compounders over Cyclicals: As inflation cools, corporate profit margins are likely to face pressure from slowing top-line revenue growth. Companies with strong balance sheets, high barriers to entry, and secular growth drivers are better positioned to maintain earnings stability than highly cyclical businesses.
- Long-Duration Growth over Commodity Producers: Lower long-term yields tend to support equity valuation multiples, particularly for high-quality growth stocks whose cash flows are weighted toward the future. Conversely, commodity producers and highly cyclical sectors are likely to face headwinds as the temporary energy shock subsides and global demand moderates.
Ultimately, inflation is not defined by a single monthly data point, but by the structural forces that drive the broader economic regime. While headline CPI may continue to fluctuate in response to geopolitical developments and energy market volatility, the primary leading indicator—wage growth—has been cooling for fifty months. Until this underlying trend reverses, the broader macroeconomic outlook continues to point toward disinflation rather than acceleration.
