
Executive Summary: A Resilient Rally
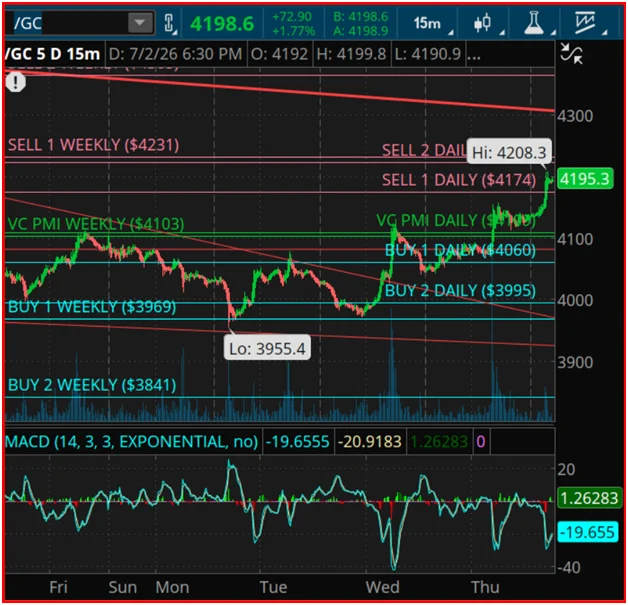
Gold futures have demonstrated remarkable resilience in the latest trading cycle, staging a robust recovery that saw prices climb from an intraday floor of approximately $3,955.40 to a high near $4,198.60. This aggressive move, fueled by a resurgence in buying pressure, has successfully breached key technical thresholds, signaling a pivotal shift in short-term market sentiment. By decisively clearing both the Daily and Weekly Variable Changing Price Momentum Indicator (VC PMI) Mean Prices—anchored at $4,100 and $4,103, respectively—gold has effectively neutralized recent bearish headwinds and established a new foundation for the current bullish trajectory.
The market’s ability to pivot from the $3,955.40 low suggests a deep-seated demand for the precious metal, reinforcing the view that the intermediate-term cycle remains firmly in the hands of the bulls. As traders navigate this volatility, the confluence of VC PMI data, Square of 9 harmonic analysis, and seasonal cycle alignment provides a structural framework for understanding the path ahead.
Chronology: The Intraday Transformation
The recent price action in gold futures is a testament to the volatility that characterizes the current macroeconomic environment. The session began with a test of the lower bounds, as traders initially pushed the price toward the $3,955.40 level—a move that tested the resolve of market participants. However, the anticipated breakdown failed to materialize, giving way to a sustained accumulation phase.
As the trading cycle progressed, the momentum shifted decisively. By mid-day, the upward momentum carried the metal through the crucial $4,100 Mean Price barrier. The technical significance of this breakout cannot be overstated; once the price cleared the $4,103 Weekly Mean, it invalidated the short-term bearish bias that had plagued the earlier hours. The rally gained velocity as it approached the $4,198 level, effectively resetting the market’s focus toward the upper-tier supply zones defined by the VC PMI.
Supporting Data: Technical Framework and Analysis
To understand the mechanics of this rally, one must look toward the proprietary analytical tools that define these price objectives.
The VC PMI Advantage
The Variable Changing Price Momentum Indicator (VC PMI) provides a mathematical approach to identifying high-probability zones. By calculating the mean—the equilibrium point where supply and demand are balanced—the indicator allows traders to determine whether the market is currently overextended or undervalued.

- Daily Mean Price ($4,100): The anchor for the current session. Staying above this level confirms the daily trend as bullish.
- Weekly Mean Price ($4,103): The primary support anchor. As long as gold holds this position, the broader weekly trend remains supportive of long-side participation.
- Resistance Levels: The current target for the bulls is the Daily Sell 1 level at $4,174, followed by the formidable Weekly Sell 1 barrier at $4,231.
Square of 9 and Harmonic Resistance
Beyond standard price points, the market is currently navigating a "Square of 9" harmonic resistance window. This methodology, rooted in W.D. Gann’s time-and-price theory, suggests that price action is not random but follows a geometric progression. As gold advances, it is entering a zone where price and time are converging. This alignment acts as a "speed bump" for the current trend. It is at these harmonic windows that the probability of a reversal—or at the very least, a significant period of consolidation—reaches its zenith. Traders are cautioned against "chasing" the price directly into these levels, as the potential for a mean reversion increases exponentially the closer the asset gets to these calculated geometric resistance points.
Market Implications: Managing the Cycle
The current structural outlook for gold is buoyed by a rare convergence of short-term and annual cycles. Historically, when these cycles align, the market exhibits a more predictable rhythm, allowing for more disciplined entries and exits.
The Seasonal Perspective
Gold is currently progressing through a seasonal phase that has historically favored positive price performance. By analyzing the overlap between shorter-term trading cycles and the larger annual cycle, market observers can better gauge the longevity of the current rally. The primary cycle dates currently being monitored serve as the "guardrails" for this trend. Provided these time-based milestones are respected, the path of least resistance remains to the upside.
Risk Management and Strategy
In the context of the current price action, the strategy for institutional and retail participants alike must be one of tactical discipline:
- Scaling Out: As gold approaches the Sell 1 ($4,174) and Sell 2 ($4,231) zones, the mandate is to reduce exposure. These levels are supply zones where institutional selling historically outpaces buying. Profit-taking here is not just a suggestion; it is a vital component of risk management.
- Buying the Dips: Conversely, any retracement toward the Daily or Weekly Mean prices should be viewed through the lens of opportunity. As long as the market remains above $4,103, the "buy the dip" strategy remains the primary operational thesis.
- Protective Stops: With volatility expected to rise as we approach resistance, tightening stops on existing long positions is essential to protect realized gains from the recent move from the $3,955 lows.
The Synthesis of Quantitative and Traditional Analysis
The effectiveness of this analysis lies in its ability to strip emotion from the decision-making process. By utilizing the VC PMI to identify objective supply and demand zones, and the Square of 9 to identify temporal resistance, traders can operate within a framework that relies on probability rather than speculation.
The market is currently in a "wait and watch" mode as it tests the limits of its current harmonic window. A confirmed breakout above the Weekly Sell 1 level ($4,231) would signal an acceleration of the trend, potentially setting the stage for a move toward higher targets. Conversely, a failure to hold the $4,103 mean would suggest a transition back into a range-bound environment, necessitating a shift in tactics.

Final Outlook
As we look toward the upcoming trading sessions, the bullish sentiment remains the dominant narrative. The successful defense of the $3,955 support level has solidified the market’s footing, and the subsequent move above the mean prices confirms a regime of strength. However, the approach toward $4,231 should be treated with the caution that harmonic resistance demands.
The convergence of time and price is a powerful indicator, and in the current climate, it serves as a reminder that markets move in cycles. By maintaining a disciplined approach—scaling out at resistance and adding at support—traders can effectively leverage these probabilistic tools to navigate the complexities of the gold market. The objective is not to predict the exact top or bottom, but to remain consistently aligned with the high-probability path defined by the data.
Disclosure and Legal Notice
This report is provided for educational and informational purposes only. It does not constitute financial advice, investment recommendations, or a solicitation to buy or sell any financial instruments, including but not limited to futures, options, or ETFs. Trading in the futures market involves substantial risk of loss and is not suitable for every investor. The leverage inherent in futures trading can work for or against you, and you may lose more than your initial investment. Past performance is not indicative of future results.
The VC PMI and Square of 9 methodologies are analytical tools intended to assist in identifying probabilistic price levels. These tools should never be used in isolation but should always be integrated into a comprehensive risk management strategy. Investors are encouraged to consult with a qualified financial advisor and perform their own independent due diligence before making any investment decisions. The information provided herein is based on technical data and historical cycles and does not account for fundamental shifts, geopolitical events, or sudden market shocks that can impact price movement.
