
Executive Summary: The Technical Landscape
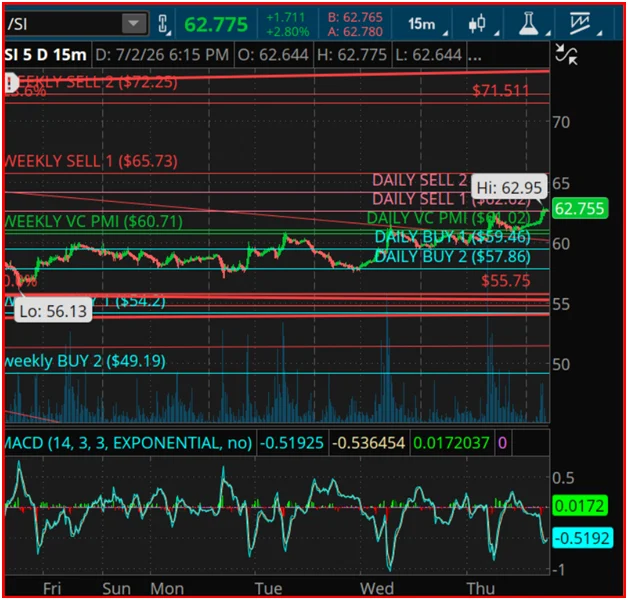
Silver has embarked on a compelling bullish trajectory, demonstrating remarkable resilience as it successfully reclaimed the Weekly Variable Changing Price Momentum Indicator (VC PMI) Mean Price at $60.71. Currently trading in the vicinity of $62.78, the precious metal is positioned firmly within the "sweet spot" between its Weekly Mean and the first major upside objective—the Weekly Sell 1 target at $65.73. This price action reinforces a robust bullish structure, characterized by a series of higher lows defended by institutional buyers.
The current market environment is not merely a product of random sentiment; it is a manifestation of quantitative alignment. By merging algorithmic mean reversion models with the geometric principles of W.D. Gann’s Square of 9 and complex time-cycle analysis, traders are witnessing a convergence of technical factors that suggests silver may be on the cusp of a significant expansion phase.
Chronology: A Roadmap of Cyclical Significance
The current strength in silver is arriving at a critical juncture in the calendar. We are entering a "harmonic window" where three distinct time cycles are converging, historically known for triggering trend reversals and spikes in volatility.
The Cycle Timeline
- June 28, 2026 (The 180-Day Cycle Low): Serving as the foundation for the current move, this cycle low established the base from which the current accumulation phase began.
- July 7, 2026 (The 270-Day Seasonal Cycle): This point represents the intersection of seasonal supply-demand shifts that often precede mid-summer rallies.
- July 15, 2026 (Mid-Month Acceleration): An identified window for market momentum to gain velocity.
- July 31, 2026 (End-of-Month Projection): A critical target for measuring the sustainability of the current monthly trend.
- September 28, 2026 (The 360-Day Annual Cycle): The long-term anchor for the current market cycle, expected to provide a final validation of the year’s trend structure.
This clustering of timing windows acts as a "pressure cooker" for price action. When multiple cycles align, the probability of a decisive breakout increases, as the market exhausts its corrective phases and prepares for a directional move.
Supporting Data: The VC PMI and Geometric Resistance
The VC PMI algorithm provides the mathematical framework to navigate this volatility. By identifying statistically significant zones of price imbalance, the model dictates a "buy the correction" strategy as long as prices maintain their position above the Daily Mean of $61.02.

Quantitative Benchmarks
- Support Zones: The Daily Buy 1 level at $59.46 and the Daily Buy 2 level at $57.86 act as the defensive perimeter for bulls. As long as these levels hold, the structural integrity of the uptrend remains uncompromised.
- Resistance Objectives: The market is currently challenging the Daily Sell 1 zone ($62.62) and the Daily Sell 2 level ($62.95).
Beyond the algorithm, the W.D. Gann Square of 9 adds a geometric layer of analysis. The market is currently rotating through a high-stakes area of resistance. A decisive daily close above the $62.95 level would confirm a new "degree of vibration," a technical phenomenon that often precedes an aggressive move toward the Weekly Sell 1 objective of $65.73. Should that level fall, the path of least resistance opens up toward the $72.25 target—a level that would represent a significant breakout in the silver market.
Furthermore, the MACD (Moving Average Convergence Divergence) oscillator is showing signs of stabilization. The fading of downward momentum, combined with the price holding above key algorithmic support, suggests a positive divergence. In institutional trading circles, this setup is often viewed as the "calm before the storm," where the lack of selling pressure allows buyers to reclaim control with minimal resistance.
Institutional Implications: Managing Probability
The core of the VC PMI philosophy is that markets are naturally prone to mean reversion. According to the data, probabilities favor a return to the mean approximately 90% of the time once a Buy 1 or Sell 1 level is reached, climbing to 95% at the Buy 2 or Sell 2 extremes.
Strategic Recommendations for Traders
For market participants, these statistics imply that chasing prices at the extremes is a high-risk endeavor. Instead, the methodology emphasizes:
- Scaling Positions: Rather than committing full exposure at a single price point, traders should utilize the VC PMI levels to layer entries and exits.
- Disciplined Risk Management: The algorithmic support levels serve as natural stop-loss triggers. If the market decisively breaks below these levels, it invalidates the current bullish thesis, requiring a pivot in strategy.
- The "Mean Reversion" Play: Traders are encouraged to look for entries when the market pulls back toward the Daily Mean, treating these dips as accumulation opportunities rather than signs of a trend reversal.
The current environment suggests that silver is transitioning from a period of consolidation into a high-probability accumulation phase. With the convergence of technical support and long-term cycle lows, the setup is primed for a sustained upside advance, provided that the current support structure holds against market volatility.

Expert Commentary and Disclosure
The Variable Changing Price Momentum Indicator (VC PMI) is not merely a trend-following tool; it is a proprietary quantitative model that strips away emotional noise to reveal the underlying supply-and-demand dynamics of the silver market. By combining probability analysis with the timeless geometric insights of W.D. Gann, the model offers a sophisticated lens through which to view current market behavior.
Important Risk Disclaimer:
It is vital for all market participants to recognize that the integration of VC PMI, Square of 9, and time-cycle analysis are educational and analytical in nature. They provide a roadmap based on historical probabilities, but they do not serve as a guarantee of future market performance.
Trading in futures, options, and other leveraged financial instruments carries a substantial risk of loss and may not be suitable for every investor. The potential for high reward is inherently linked to the risk of significant financial exposure. Past performance is never a definitive indicator of future results. Investors are strongly urged to exercise independent judgment, conduct their own due diligence, and implement rigorous money management protocols before executing any trades based on these or any other technical indicators.
As we approach the mid-July acceleration window, the silver market remains a focal point for those looking to capitalize on cyclical turns. The combination of technical strength and harmonic cycle convergence suggests that the coming weeks will be pivotal for precious metals. Whether the market confirms the breakout toward $65.73 or retreats to retest the $59.46 support, the VC PMI framework provides the clarity needed to navigate the volatility with precision and discipline.
The silver market is currently exhibiting the classic characteristics of a coiled spring. With the technical structure intact and the cyclical timing aligned, the next significant move is likely to be characterized by expanded range and increased velocity. Investors who maintain a disciplined, probability-based approach will be best positioned to benefit from the shifting momentum in the weeks ahead.
