
 By Evan Lee Salim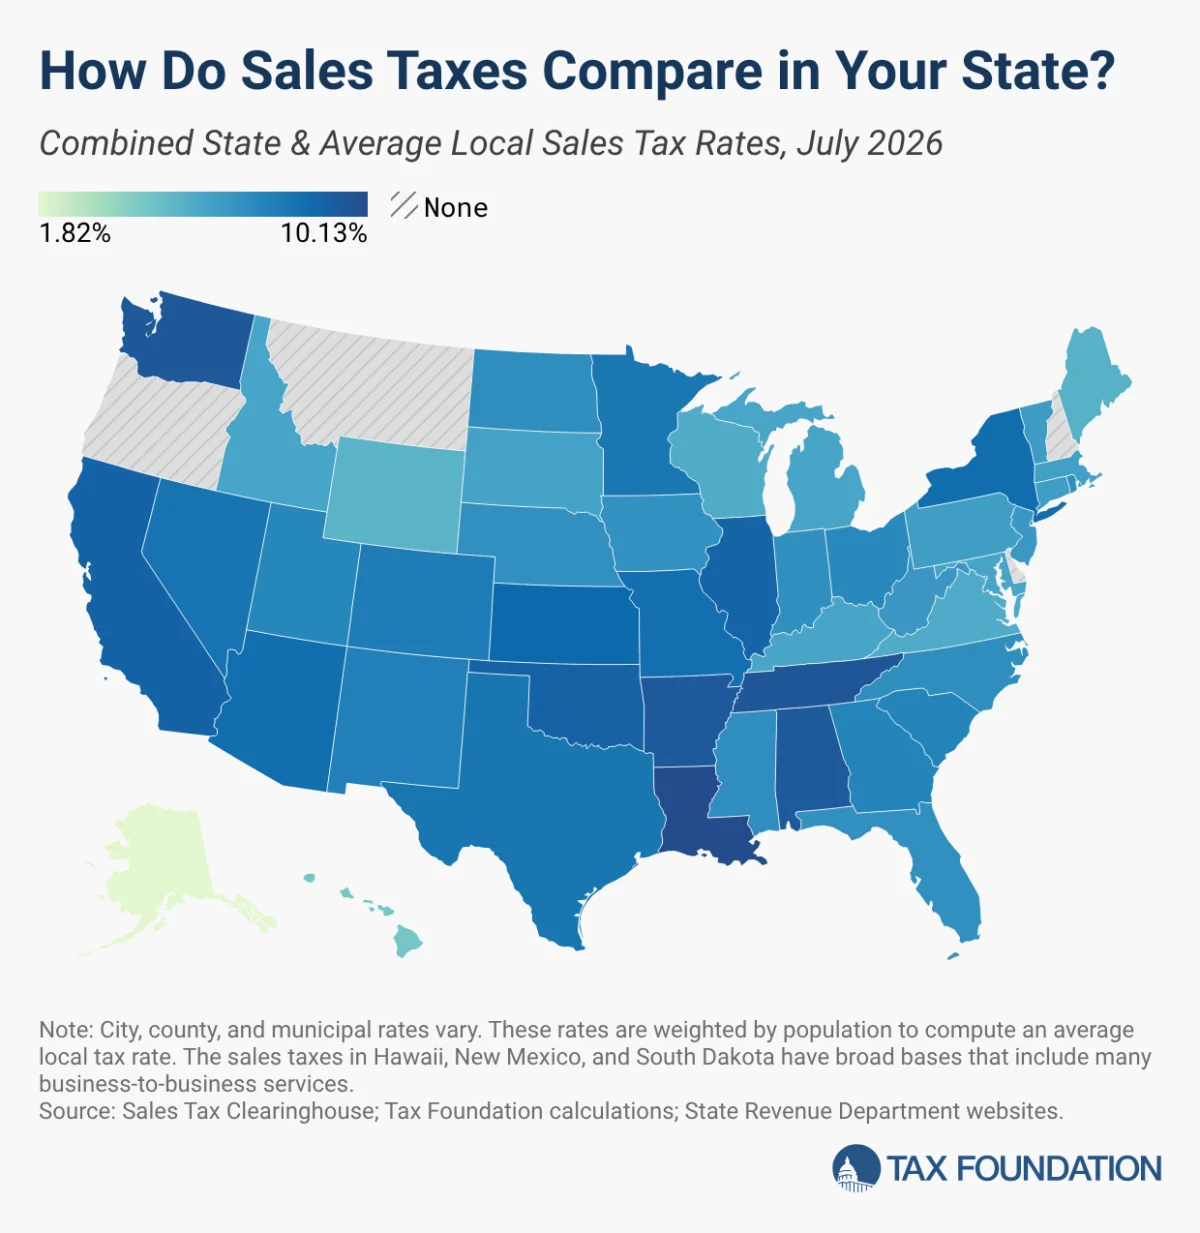
Retail sales taxes represent the fiscal backbone of American state governments. As of mid-2026, these levies account for approximately 32 percent of all state tax collections and 13 percent of local revenue, totaling nearly a quarter of all combined sub-national tax receipts. Because they are broadly applied to consumption rather than production or income, economists generally view them as more pro-growth than progressive income taxes, as they tend to minimize economic distortions.
However, the reality of the American tax landscape is far from uniform. With 45 states levying a state-level sales tax and 38 states authorizing local jurisdictions to impose their own surcharges, the burden on the consumer varies wildly depending on their ZIP code. As of July 1, 2026, navigating this patchwork of regulations is essential for businesses and households alike.
The Geography of Taxation: Where the Burden is Heaviest
The variation between states is driven largely by the aggressive use of local option taxes. In some instances, local rates are so substantial that they rival or even exceed the statewide base rate.
As of the most recent data, the five states with the highest combined state and local sales tax rates are:
- Louisiana (10.13%): The undisputed leader in combined tax pressure.
- Tennessee (9.61%): High reliance on sales tax, bolstered by the absence of an individual income tax.
- Washington (9.57%): A state that relies heavily on consumption taxes to fund government services.
- Arkansas (9.48%): Maintaining a high combined burden through robust local options.
- Alabama (9.46%): Featuring some of the highest local average rates in the nation.
Nationwide, the population-weighted average combined sales tax rate sits at 7.53 percent. While this provides a baseline, it masks the volatility of local adjustments that occurred throughout early 2026. States such as North Carolina, Georgia, California, and Vermont saw upward trends in their combined rates due to localized policy shifts. Conversely, Wyoming stood out as the lone state to implement a reduction, thanks to several jurisdictions choosing to scale back their local option taxes during the February and July reporting periods.
A Chronological Overview of Recent Policy Shifts
The trajectory of sales tax reform over the last two years has been characterized by a move toward broader tax competitiveness.
- January 2025: Louisiana implemented a significant tax reform package, raising the state sales tax rate from 4.45% to 5.0%. While this increased the consumption tax burden, it was strategically paired with the introduction of a 3% flat individual income tax and a reduction in the corporate income tax, signaling a pivot toward shifting the tax base from income to consumption.
- July 2022 – 2023: New Mexico lowered its "gross receipts tax"—a complex hybrid tax that functions like a sales tax—from 5.125% to 4.875%. However, this is subject to a "snap-back" provision: if revenue in any fiscal year between 2026 and 2029 falls below 95% of the previous year’s intake, the rate will automatically revert to 5.125%.
- January 2026: Illinois made a significant consumer-friendly adjustment by eliminating its 1% sales tax on groceries. While intended to provide cost-of-living relief, the move was partially blunted as numerous local jurisdictions opted to impose their own municipal taxes on food items to fill the resulting revenue gap.
- Mid-2026: The first half of the year saw no major statewide rate changes, indicating that state legislatures are currently prioritizing stability or focusing on other fiscal tools, such as income tax cuts, which are perceived to offer higher immediate returns on economic investment.
Supporting Data: Understanding the "Tax Mix"
It is a mistake to view sales taxes in a vacuum. A state’s tax burden is a product of its entire "tax mix." For example, Tennessee maintains some of the highest sales tax rates in the nation, yet it remains an attractive destination for retirees and businesses because it levies no individual income tax. In contrast, Oregon offers the opposite model: no sales tax, but high reliance on income taxation.
State-Level Rate Leaders (2026)
- Highest State-Level Rate: California (7.25%) leads the nation, though this includes mandatory local add-ons.
- Second Highest: Indiana, Mississippi, Rhode Island, and Tennessee (all at 7.0%).
- Lowest Non-Zero Rate: Colorado (2.9%), followed by a group of five states at 4% (Alabama, Georgia, Hawaii, New York, and Wyoming).
- The Zero-Tax Club: Alaska, Delaware, Montana, New Hampshire, and Oregon remain the only states without a statewide sales tax. Note that while Alaska lacks a state rate, it is the only state in this group that allows local municipalities to levy their own, often significant, sales taxes.
Local Tax Concentration
The impact of local taxes is not distributed equally. Alabama leads the nation in average local sales tax rates (5.46%), followed closely by Louisiana (5.13%) and Colorado (4.99%). These rates are often used to fund specific community projects, such as the "Floating Local Option Sales Tax" in Georgia, which allows counties to levy temporary taxes specifically to provide property tax relief.
Official Responses and Strategic Implications
The implications of these rates are profound for both consumer behavior and business location strategies. The phenomenon of "tax avoidance" is well-documented; when a significant rate differential exists between two neighboring jurisdictions, commerce inevitably shifts.
Consumer Behavior and Retail Flight
Research consistently shows that consumers are willing to travel to avoid high-tax zones. A primary example is the Chicago area, where a 10.25% combined rate drives significant retail leakage into neighboring suburbs with lower rates. Similarly, in New England, the contrast between Vermont and New Hampshire serves as a textbook study in tax competition. Because New Hampshire lacks a sales tax, retail activity in border counties has tripled since the 1950s, while retail in Vermont’s border counties has remained stagnant.
The "Base" Problem: Beyond the Rate
While this analysis focuses on rates, the "base"—what is actually taxed—is equally important. The ideal tax system, according to the Tax Foundation, would apply to all final consumption once and only once, exempting business-to-business transactions to prevent "tax pyramiding."
However, current practices are far from this ideal. Hawaii, for instance, maintains the broadest base in the country, taxing many products multiple times throughout the production cycle. By some estimates, Hawaii’s sales tax applies to 119% of the state’s personal income, a stark contrast to the national median of 36%. This highlights a critical, often overlooked reality: a state with a "low" rate but a "broad" base can actually be more burdensome than a state with a "high" rate on a narrow list of items.
Conclusion: The Future of Sales Tax Policy
For policymakers, the challenge remains balancing the need for stable, non-distortionary revenue with the competitive necessity of keeping total tax burdens manageable. As states continue to modernize their tax codes, the focus is likely to shift away from simple rate hikes toward base broadening—ensuring that the tax is applied fairly and efficiently across the modern economy.
Businesses and consumers should remain vigilant. As the 2026 data indicates, even when state-level rates appear stagnant, the "silent" growth of local option taxes continues to shift the fiscal landscape. In an era of increasing mobility, those jurisdictions that maintain simple, transparent, and moderate sales tax regimes are the most likely to capture long-term investment and consumer loyalty.
Methodology Note: The data provided utilizes population-weighted averages based on the most recent Census ZCTA (ZIP Code Tabulation Area) figures. This methodology is designed to provide a more accurate reflection of the actual tax burden experienced by the average resident, rather than a simple geographic average of tax jurisdictions.
 Ali Ikhwan
  Suro Senen
  Reynand Wu