
 By Iffa Jayyana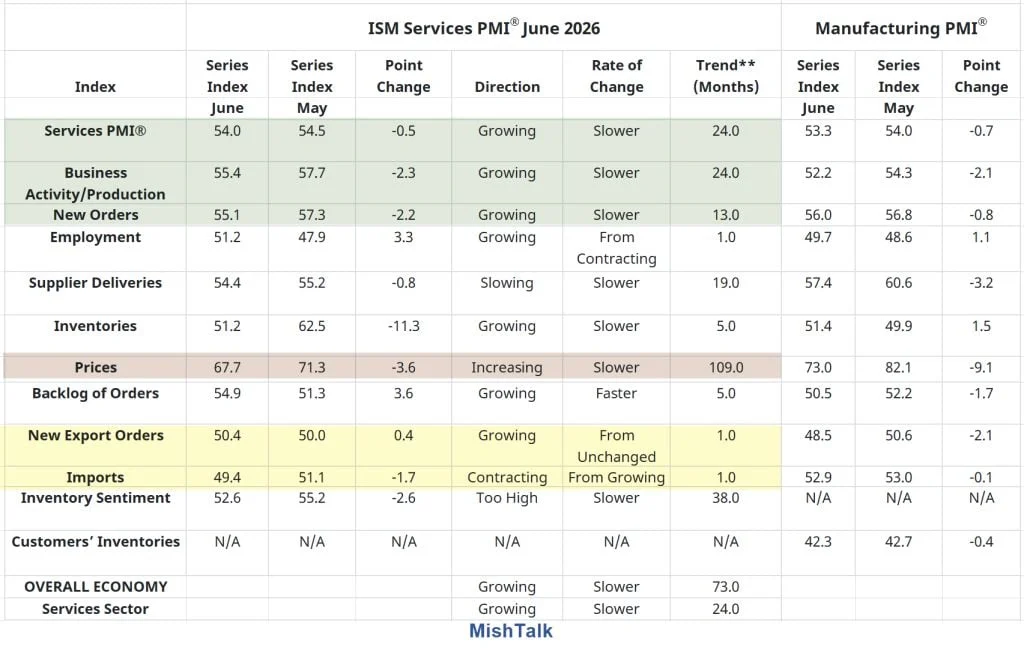
The vast United States services sector, which serves as the primary engine of the domestic economy, demonstrated continued resilience but experienced a slight deceleration in growth in June 2026. According to the latest Services ISM® Report on Business, released by the Institute for Supply Management® (ISM®), the services purchasing managers’ index (PMI®) cooled slightly to 54.0 percent, down from May’s reading of 54.5 percent.
While any reading above 50.0 percent indicates expansion, the marginal decline highlights a broader trend of economic normalization, characterized by cooling consumer demand, treading-water trade activity, and stabilizing supply chains. Despite the minor pullback in overall growth, the report brought highly anticipated news: a notable rebound in the services labor market, which returned to expansionary territory after three consecutive months of contraction. Conversely, inflationary pressures within the sector—while still historically high—dropped to their lowest level since February, offering a glimmer of relief to policymakers and businesses alike.
Main Facts: June 2026 ISM Services PMI at a Glance
To understand the current trajectory of the U.S. services economy, it is essential to examine the core metrics that constitute the composite PMI. Below is a summary of the key data points from the June 2026 report, contrasted with the performance of the prior month:
- Services PMI®: Registered 54.0 percent, a decrease of 0.5 percentage points from May’s reading of 54.5 percent. This represents the 19th consecutive month of overall expansion for the services sector.
- Business Activity Index: Decreased to 55.4 percent, down 2.3 percentage points from the robust 57.7 percent recorded in May.
- New Orders Index: Fell to 55.1 percent, representing a 2.2 percentage point decline from May’s figure of 57.3 percent.
- Employment Index: Rebounded to 51.2 percent, surging 3.3 percentage points from May’s contractionary reading of 47.9 percent. This marks the first expansion in services employment in four months.
- Supplier Deliveries Index: Registered 54.4 percent, down 0.8 percentage points from May’s 55.2 percent. Because this index is inversed, a reading above 50.0 percent indicates slower deliveries, pointing to ongoing, albeit slightly improving, supply chain friction.
- Prices Index: Declined to 67.7 percent, a decrease of 3.6 percentage points from May’s reading of 71.3 percent, falling below the 70.0 percent threshold for the first time since February.
Chronology: Navigating the Mid-2026 Economic Transition
The June 2026 report marks a critical juncture in the post-pandemic, late-cycle economic narrative. To put these numbers into context, we must trace the path of the services sector over the first half of 2026.
[Q1 2026: Persistent Inflation] ──> [May 2026: Demand Peaks, Labor Contracts] ──> [June 2026: Demand Moderates, Labor Rebounds]
  - Prices consistently > 70%          - Services PMI at 54.5%                        - Services PMI cools to 54.0%
  - Supply chains bottlenecked         - Employment contracts to 47.9%                - Employment expands to 51.2%
  - Labor market shows fatigue         - Prices remain high at 71.3%                  - Prices drop to 67.7%
During the first quarter of 2026, the services sector faced persistent headwinds from sticky input costs and volatile labor dynamics. The Prices Index consistently hovered above the 70.0 percent mark, raising concerns that inflation was becoming deeply entrenched in service-oriented industries, which include retail, healthcare, hospitality, and financial services.
By May 2026, a divergence had emerged: consumer demand remained robust, pushing the New Orders and Business Activity indexes to high expansionary levels, yet businesses struggled to hire. The Employment Index fell to 47.9 percent, marking the third consecutive month of contraction as companies cited a lack of qualified candidates, high wage expectations, and strategic hiring freezes amid economic uncertainty.
June 2026, however, brought a reversal of these trends. The frantic pace of new orders and business activity moderated, signaling a healthy cooling of demand. Simultaneously, the labor market found its footing, breaking its three-month losing streak. This rebalancing suggests that while the peak of the post-pandemic expansion has passed, the services sector is settling into a more sustainable, non-inflationary growth path.
Supporting Data: A Detailed Sub-Index Analysis
A closer inspection of the individual components of the ISM Services report reveals the underlying mechanics of this mid-year moderation.
1. Demand and Activity: A Necessary Cooling
Both the Business Activity Index (55.4 percent) and the New Orders Index (55.1 percent) remain comfortably above the 50.0 percent expansion threshold. However, their month-over-month declines (2.3 and 2.2 percentage points, respectively) indicate that consumers and businesses are becoming more selective in their spending.
Historically, a rapid pace of new orders can strain supply chains and drive up prices. The moderation in June suggests that the Federal Reserve’s prolonged restrictive monetary policy is successfully dampening excess demand without triggering a sharp contraction.
2. The Labor Market Turnaround
The most encouraging takeaway from the June report is the Employment Index‘s rise to 51.2 percent. After languishing in contractionary territory for three months, the 3.3 percentage point increase indicates that service providers are successfully filling open positions.
Industry analysts suggest this rebound could be attributed to seasonal summer hiring, a marginal increase in labor participation, or a cooling of wage demands, which has made hiring more financially viable for mid-sized firms.
3. Supply Chain Bottlenecks and Supplier Deliveries
The Supplier Deliveries Index came in at 54.4 percent. Under the ISM’s methodology, a reading above 50.0 percent indicates that deliveries are slowing. June marks the 19th consecutive month that this index has remained in expansionary (slower) territory.

While slower delivery times are traditionally a sign of a strong economy with high demand, the persistent nature of these delays suggests that structural logistics challenges—ranging from regional labor shortages in transportation to geopolitical disruptions affecting global trade routes—continue to linger.
4. Input Prices: Relief, but No Victory Lap
The Prices Index dropped to 67.7 percent from May’s 71.3 percent. This is a significant psychological and economic milestone, as it represents the first time the index has fallen below 70.0 percent since February 2026.
However, the index has now exceeded 60.0 percent for 19 consecutive months, matching its 12-month average of 68.0 percent. This prolonged elevated state demonstrates that while the rate of price increases is slowing, input costs for services are still rising at a rapid historical pace.
| ISM Services Sub-Index | May 2026 (%) | June 2026 (%) | Monthly Change (Percentage Points) | Direction |
|---|---|---|---|---|
| Services PMI® | 54.5 | 54.0 | -0.5 | Growing (Slower) |
| Business Activity | 57.7 | 55.4 | -2.3 | Growing (Slower) |
| New Orders | 57.3 | 55.1 | -2.2 | Growing (Slower) |
| Employment | 47.9 | 51.2 | +3.3 | Growing (Faster) |
| Supplier Deliveries | 55.2 | 54.4 | -0.8 | Slower (Slower) |
| Prices Paid | 71.3 | 67.7 | -3.6 | Increasing (Slower) |
Official Responses and Industry Sentiment
Commentary from the ISM Chair
In delivering the report, Steve Miller, CPSM, CSCP, Chair of the Institute for Supply Management® Services Business Survey Committee, offered a balanced perspective on the sector’s current health:
"In June, the Services PMI® registered 54 percent, a decrease of 0.5 percentage point compared to May’s figure of 54.5 percent. The Business Activity Index remained in expansion territory in June, decreasing 2.3 percentage points to 55.4 percent from May’s reading of 57.7 percent. The New Orders Index registered 55.1 percent, 2.2 percentage points below May’s figure of 57.3 percent."
Miller highlighted the significance of the labor market recovery, noting:
"The Employment Index expanded for the first time in four months with a reading of 51.2 percent, a 3.3-percentage point increase from the 47.9 percent recorded in May. All of the four subindexes that make up the composite PMI® were above their 12-month moving averages."
Addressing the persistent supply chain and pricing pressures, Miller added:
"The Supplier Deliveries Index registered 54.4 percent, 0.8 percentage point lower than the 55.2 percent recorded in May. This is the 19th consecutive month that the index has been in expansion territory, indicating slower supplier delivery performance… The Prices Index decreased to 67.7 percent in June, 3.6 percentage points below May’s figure of 71.3 percent and its first time below 70 percent since February. The index has exceeded 60 percent for 19 straight months, maintaining its 12-month average of 68 percent."
Miller also pointed out an interesting anomaly in commodity markets, particularly concerning energy and fuel:
"Diesel, fuel, and related commodities were once again most frequently mentioned as up in price in June — and cited as down in price from other respondents. This is likely due to different contract terms for these commodities between companies."
Respondent Sentiment: Navigating a Mixed Environment
Feedback from the survey’s corporate respondents paints a complex picture of the ground-level economic reality. While the general sentiment remains cautious, there was a noticeable increase in positive commentary compared to the highly pessimistic reports of previous months.
Many executives expressed relief over stabilizing energy prices, though they remained wary of long-term contract commitments. A respondent from the retail trade sector noted that while customer foot traffic has plateaued, average basket sizes remain steady, preventing a steeper decline in revenue. Conversely, representatives from the construction and professional services sectors voiced ongoing concerns about high borrowing costs and the difficulty of projecting capital expenditure budgets into the latter half of 2026.

Overall, the qualitative data suggests that businesses are adapting to a "higher-for-longer" interest rate environment, focusing on operational efficiency and selective hiring rather than aggressive expansion.
Macroeconomic Implications: What This Means for the Fed and the Economy
The June 2026 ISM Services report holds profound implications for broader monetary policy and the trajectory of the U.S. economy.
1. The Federal Reserve’s Delicate Balancing Act
For the Federal Reserve, the June data represents a partial victory. The central bank has spent over two years attempting to cool the economy and bring inflation back down to its 2.0 percent target. Because the services sector is highly labor-intensive, service-sector inflation has proven notoriously sticky.
The drop in the Prices Index to 67.7 percent will be welcomed by central bankers as evidence that inflationary momentum is finally slowing. However, because the index has remained above 60.0 percent for nearly two years, the Fed is unlikely to declare victory.
The rebound in the Employment Index (51.2 percent) further complicates the Fed’s outlook. While a strong labor market prevents a recession, it also keeps wage growth elevated, which can feed back into consumer prices. Consequently, this report supports the narrative that the Fed will maintain a cautious, data-dependent approach, likely keeping interest rates steady rather than rushing to cut them in the near term.
                  ┌───────────────────────────────┐
                  │    June 2026 ISM Services     │
                  └───────────────┬───────────────┘
                                  │
         ┌────────────────────────┴────────────────────────┐
         ▼                                                 ▼
┌─────────────────────────────────┐               ┌─────────────────────────────────┐
│       Prices Paid: 67.7%        │               │       Employment: 51.2%         │
│  (Lowest level since February)  │               │ (First expansion in 4 months)   │
└──────────────┬──────────────────┘               └──────────────┬──────────────────┘
               │                                                 │
               ▼                                                 ▼
┌─────────────────────────────────┐               ┌─────────────────────────────────┐
│   Eases immediate pressure for  │               │  Signals economic resilience,   │
│     aggressive rate hikes       │               │   but keeps wage pressures raw  │
└──────────────┬──────────────────┘               └──────────────┬──────────────────┘
               │                                                 │
               └────────────────────────┬────────────────────────┘
                                        │
                                        ▼
                     ┌─────────────────────────────────────┐
                     │       Federal Reserve Action:       │
                     │  "Higher-for-longer" rate stance,   │
                     │    cautious, data-driven approach   │
                     └─────────────────────────────────────┘
2. Trade "Treading Water"
The report notes that exports and imports are essentially "treading water." This stagnation in trade activity reflects a broader global economic slowdown. With major European and Asian economies experiencing sluggish growth, international demand for U.S. services (such as financial consulting, software, and tourism) has flattened.
Domestically, businesses are showing a preference for local supply chains to avoid geopolitical risks, keeping imports flat. This sluggishness in international trade is likely to act as a mild headwind for GDP growth in the second half of 2026.
3. The "Soft Landing" Narrative Remains Intact
Despite the cooling metrics, the June report strongly supports the "soft landing" scenario—a situation where inflation returns to target without triggering a severe recession.
A severe economic downturn would typically be heralded by a sharp drop in the Services PMI below the 50.0 percent threshold, accompanied by collapsing new orders and surging unemployment. Instead, the U.S. services economy is exhibiting a controlled glide path. Growth is slowing, but it is doing so from a position of strength, led by a resilient consumer and a stabilizing job market.
Looking Ahead to Q3 2026
As the economy transitions into the third quarter of 2026, market participants will closely watch whether the cooling trend in prices continues. Analysts predict that starting in July, an increasing number of service industries will report lower prices as supply chains normalize further and competitive pressures force businesses to absorb costs rather than passing them on to consumers.
If the Prices Index continues its downward trajectory toward the low 60s, and the Employment Index stabilizes in the low 50s, the U.S. economy may well achieve the elusive balanced growth that policymakers have spent years trying to secure.
 Nila Kartika Wati
  Azzam Bilal Chamdy