
 By Azzam Bilal Chamdy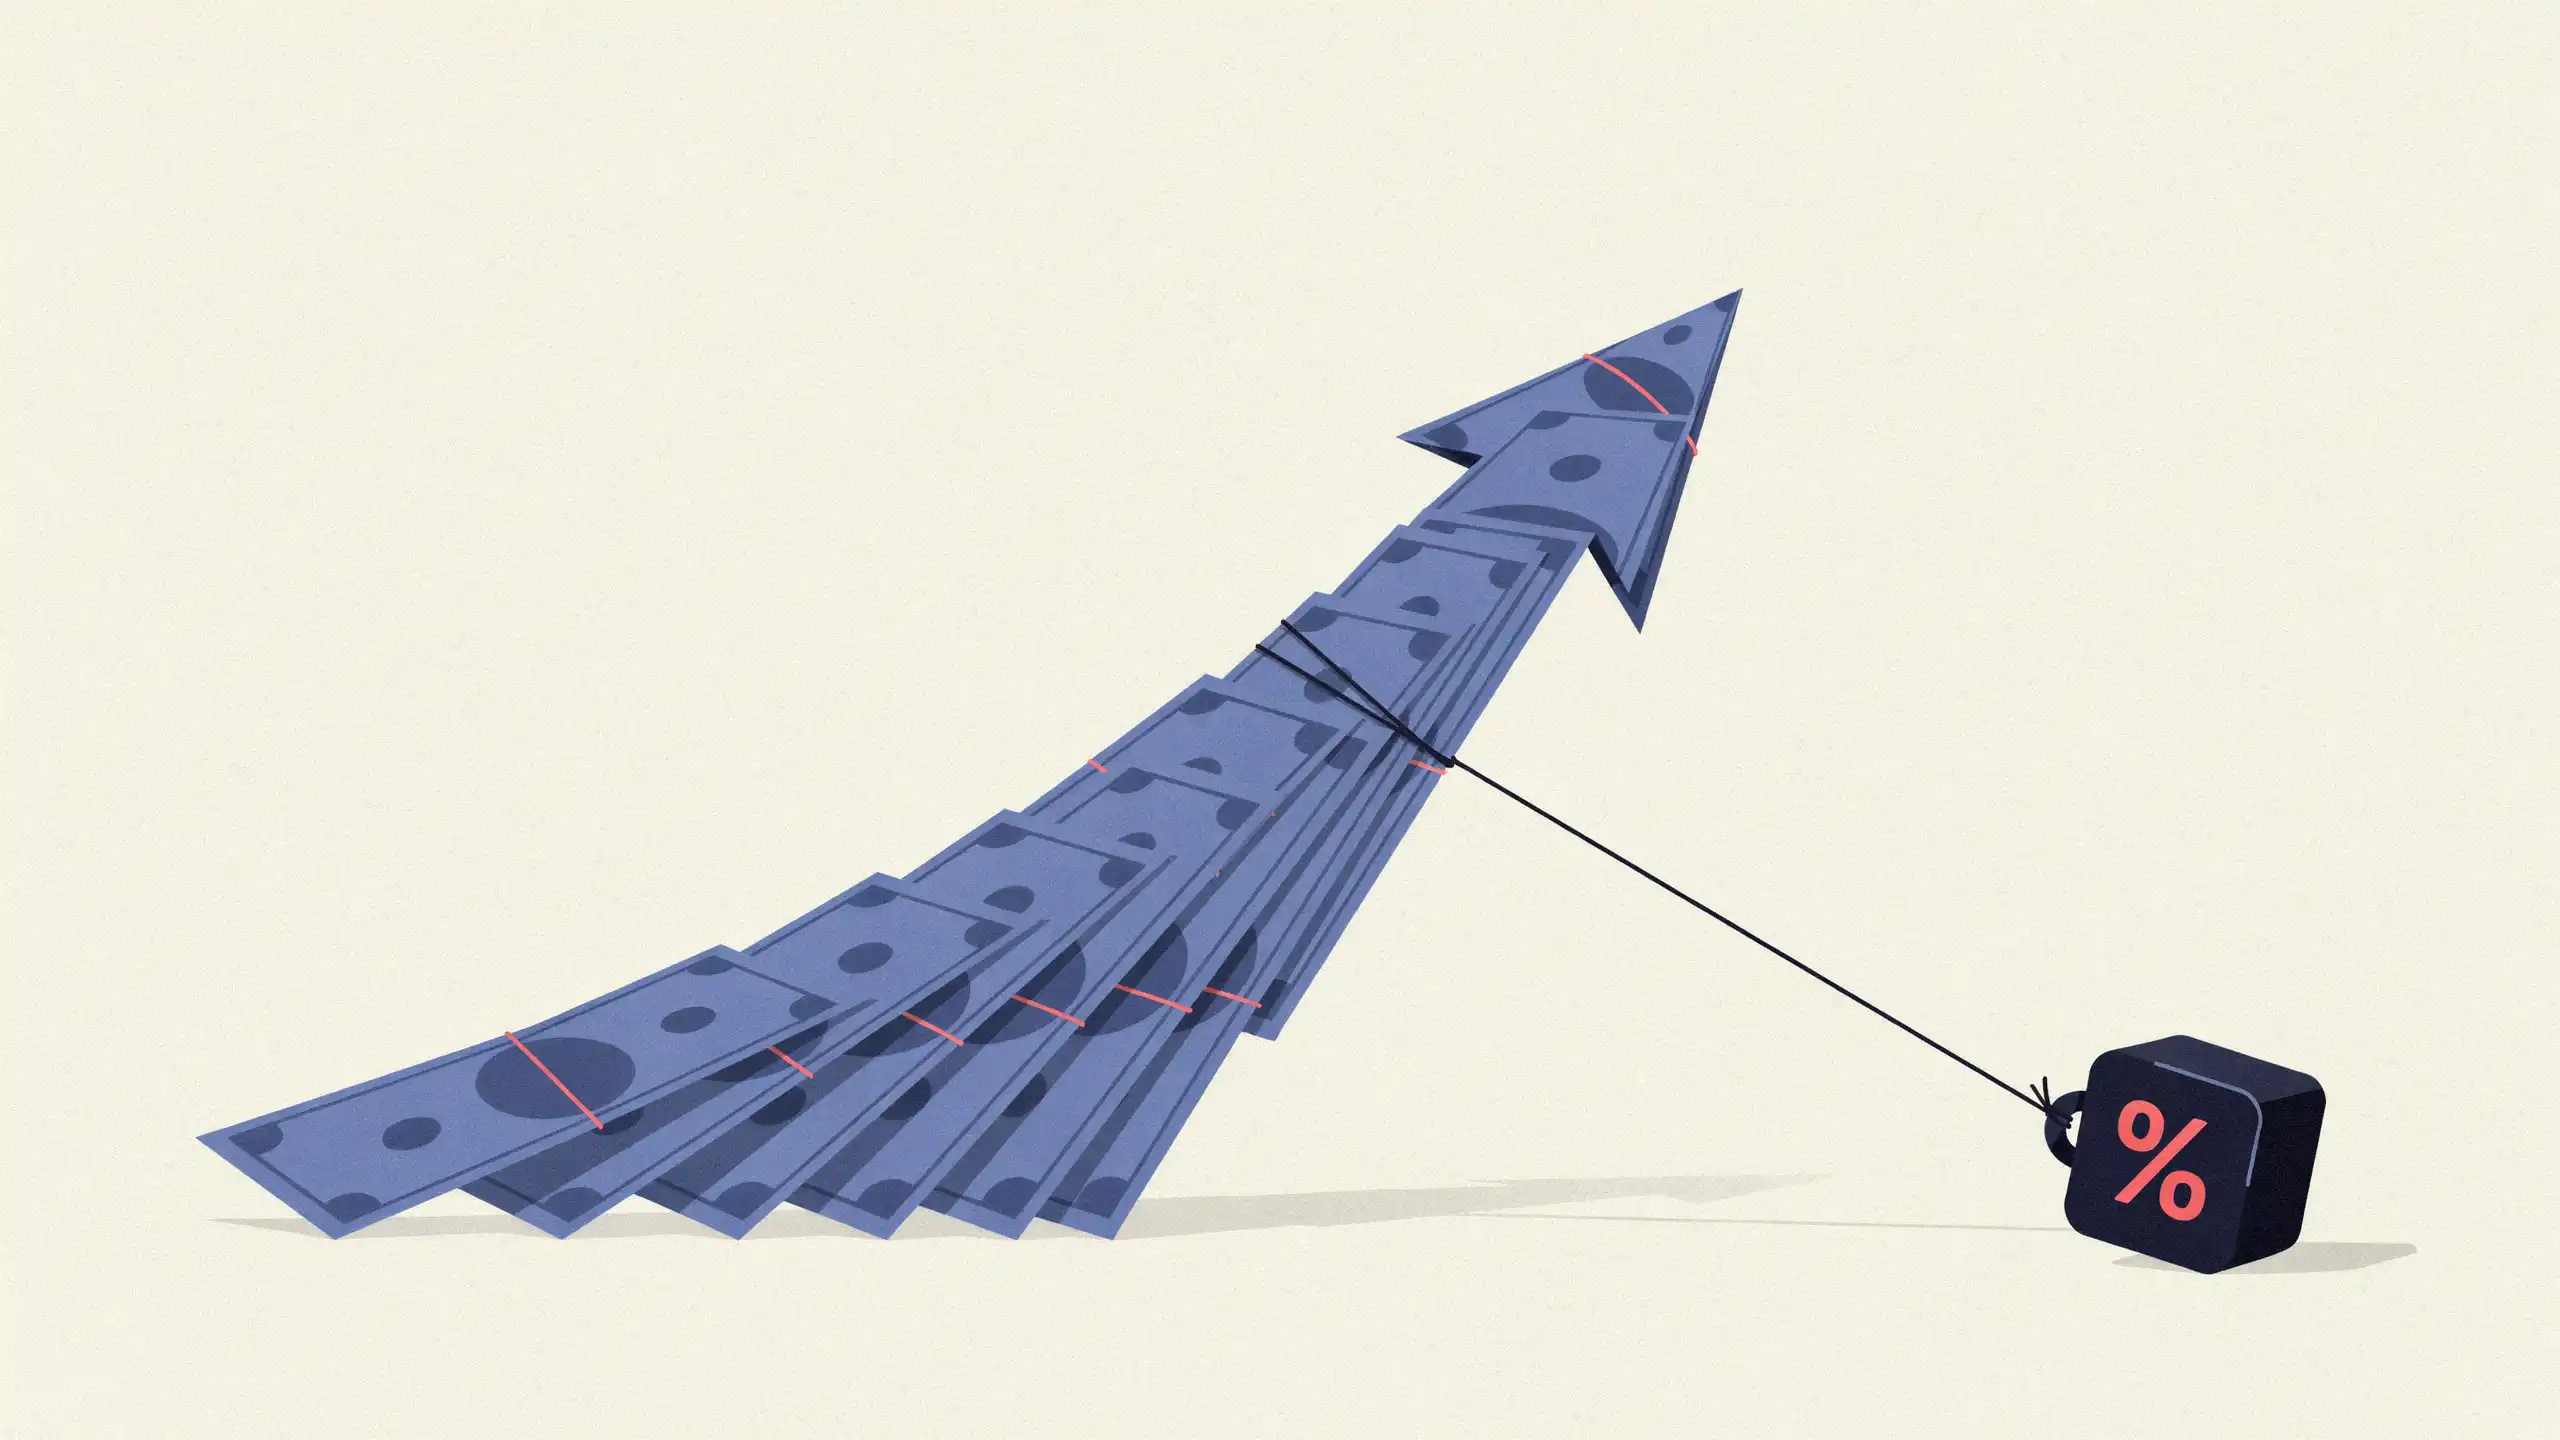
In the complex world of modern finance, the most dangerous threats are often the ones you cannot see. While investors obsess over market volatility, political instability, and the latest stock market trends, they frequently ignore the most predictable, corrosive force in their portfolio: the annual expense ratio.
For the average retail investor, an expense ratio is a ghost—a financial phantom that skims profits from your accounts before you ever receive your monthly statement. Because these fees are deducted directly from a fund’s net asset value (NAV) rather than billed as a line-item charge, they remain largely invisible. However, as the numbers demonstrate, this invisibility is not an accident—it is a structural feature that quietly siphons tens of thousands of dollars from unsuspecting savers over the course of a lifetime.
Main Facts: The Anatomy of an Expense Ratio
At its core, an expense ratio is the annual fee charged by an investment company to cover the operational costs of managing a mutual fund or Exchange Traded Fund (ETF). This percentage covers management fees, administrative expenses, marketing costs, and custodial fees.
The critical reality that most investors fail to grasp is that this fee is performance-agnostic. Whether the fund yields a 20% return or suffers a 20% loss, the management company takes its cut based on the total assets under management. If you hold $100,000 in a fund with a 1% expense ratio, you are paying $1,000 annually to the fund provider.
In contrast, many low-cost index funds offered by major brokerages currently carry expense ratios ranging from 0.03% to 0.05%. This creates a massive disparity: a fund charging 1% is effectively 20 to 33 times more expensive than a standard market-tracking index fund. While the difference between 0.03% and 1% may seem like a rounding error on a spreadsheet, the mathematical reality of compounding ensures that this gap acts as a "wealth drag" that accelerates over time.
Chronology of a Fee: How Your Money Disappears
To understand why investors fall into the "high-fee trap," one must look at the lifecycle of a typical investment journey:
- The Enrollment Phase: An investor signs up for a 401(k) or opens an IRA. They are presented with a "menu" of fund options. Often, the default options—or those highlighted as "actively managed"—come with higher expense ratios, marketed under the guise of "professional oversight" or "market beating potential."
- The Accumulation Phase: Over the next 5 to 10 years, the investor contributes consistently. Because the fee is never billed, the investor assumes the performance they see on their screen is their "net" return. They remain blissfully unaware that they have paid thousands of dollars in administrative costs.
- The Compounding Inflection Point: By year 15, the "drag" begins to accelerate. Because the fee is charged on the total balance, as the portfolio grows, the absolute dollar amount taken by the fund manager increases. An investor who started with $100,000 now has $500,000; that 1% fee has ballooned from $1,000 to $5,000 per year.
- The Realization: It is often only at the point of retirement that investors compare their total contributions to their final balance and wonder why their returns lagged behind the broader market indices (like the S&P 500). By then, the opportunity for the lost capital to have compounded is gone.
Supporting Data: The Mathematics of Wealth Erosion
The long-term impact of fee structures can be illustrated through a standardized projection. Consider a $100,000 initial investment growing at a hypothetical 7% annual return over a 20-year horizon.
- Scenario A (Low-Cost Fund): With an expense ratio of 0.05%, the investment grows to approximately $383,000.
- Scenario B (High-Cost Fund): With an expense ratio of 1.0%, the investment grows to approximately $321,000.
The result is a staggering $62,000 difference—all for the exact same market performance.
This is not a matter of "bad luck" in the market; it is a mathematical certainty. High-expense funds must consistently outperform the market by a margin greater than their fee just to break even with a low-cost index fund. Historical data from firms like Morningstar consistently shows that the vast majority of actively managed, high-fee funds fail to outperform their low-cost benchmarks over a 10- or 20-year period. When you pay a premium for "active management," you are betting against the statistical probability that the manager can provide enough value to justify the tax they impose on your principal.
Official Responses and Industry Context
The investment industry often defends higher expense ratios by citing the costs of research, analysts, and trading strategies aimed at "beating the market." They argue that passive index funds provide only average returns, while active managers provide the potential for "alpha"—returns in excess of the market.
However, financial regulators, including the U.S. Securities and Exchange Commission (SEC), have become increasingly transparent about the impact of fees. In official investor bulletins, the SEC consistently notes that "costs matter," urging investors to scrutinize the fee table in a fund’s prospectus.
Institutional investors and major pension funds have largely abandoned high-fee structures in favor of low-cost, institutional-grade index funds. The irony is that while the wealthiest institutions and the most sophisticated pension managers are moving toward cost-minimization, the average individual investor is still frequently funneled into expensive, high-fee retail products by brokerage firms that profit from the underlying management fees.
Implications: Taking Control of Your Financial Future
If the expense ratio is a "guaranteed" drag on your portfolio, the implication is clear: it is the one variable you can control with 100% certainty. You cannot predict the S&P 500’s performance next year, but you can choose the fund with the lowest possible cost.
Actionable Steps for Investors:
- The Audit: Take five minutes to log into your brokerage or 401(k) portal. Search for the "expense ratio" of every fund you own. If you cannot find it, it is usually listed on the fund’s summary prospectus page.
- The Benchmark Test: Compare your fund’s ratio to a standard, broad-market index fund (e.g., an S&P 500 ETF). If your fund is charging 0.80% or 1.0% and the index fund is charging 0.04%, ask yourself if the active manager is providing enough value to justify that 20x price difference.
- The Transition:
- In tax-advantaged accounts (401k/IRA): Switching funds is usually tax-free. You can rebalance your portfolio into cheaper alternatives without triggering a capital gains event.
- In taxable accounts: Check for "embedded capital gains" before selling. If you have a large gain, consult a tax professional. If selling would trigger a significant tax bill, you can still optimize by directing all new contributions toward lower-cost funds, gradually shifting your asset allocation over time.
- Target-Date Scrutiny: Do not assume "Target-Date" funds are all the same. While they offer convenience, their internal expense ratios can vary wildly. Some providers charge a premium for the convenience of automatic rebalancing, which may not be worth the cost if you are capable of maintaining your own asset allocation.
The Bottom Line
In the game of long-term investing, you get what you don’t pay for. By reducing your expense ratios, you are not just saving money; you are recapturing the power of compounding. Every dollar saved in fees is a dollar that remains invested, working for you, and growing for your future. Do not allow the silence of these fees to mask the volume of their impact. Inspect your portfolio today, because the most effective raise you will ever get is the one you give yourself by lowering your investment costs.
 rifanmuazin
  Nana
Nana  Lina Irawan