
 By rifanmuazin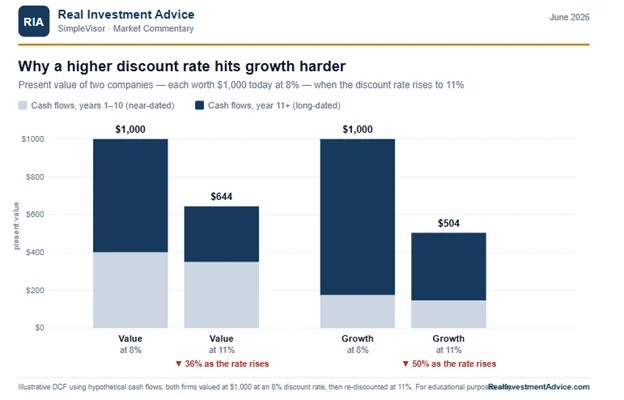
For decades, the financial commentariat has relied on a handful of "sacred" indicators to forecast the end of economic expansions. Chief among these are the flattening of the yield curve and the violent, whip-sawing rotations in equity market leadership. When these signals flash, the consensus among many analysts is immediate: a recession is imminent, and a market top is already in the rearview mirror.
However, a closer examination reveals that these metrics are frequently misunderstood. While they provide an essential diagnostic of the current economic environment, they are often misinterpreted as timing mechanisms. Relying on them as a countdown clock to a market crash is not only a common error—it is a potentially catastrophic one for portfolio management.
The Anatomy of the Yield Curve
At its core, the shape of the U.S. Treasury yield curve—the spread between short-term and long-term interest rates—is a reflection of the market’s collective expectations for the path of future federal funds rates, adjusted for the "term premium." This premium is the additional compensation investors demand for assuming the risks associated with holding long-term debt, such as inflation volatility, duration risk, and the supply-demand dynamics of the U.S. government’s borrowing needs.
Historically, the yield curve has been a potent, if blunt, instrument. When the 10-year Treasury yield falls below the 2-year yield (an inversion), it has preceded nearly every recession in the post-WWII era. Yet, the 2022 anomaly—where the curve inverted without triggering an immediate economic contraction—serves as a cautionary tale. It underscores that while the curve is a barometer, it is not a psychic.
Current Market Dynamics: The Bear Flattener
In recent months, the financial markets have entered a "bear flattener" environment. In this scenario, short-term yields rise more rapidly than long-term yields. Since late February, triggered in part by geopolitical instability and shifting inflation expectations, the 2-year Treasury note has seen yields surge by 76 basis points, while the 10-year and 30-year bonds have lagged significantly.
This divergence suggests that investors are pricing in a central bank forced to maintain restrictive conditions to combat inflation, while simultaneously tempering their long-term growth expectations. This is a classic late-cycle phenomenon. The curve flattening acts as a self-imposed brake on the economy, tightening credit conditions and increasing the cost of capital. However, an inverted curve does not necessarily dictate a recession; it merely signals that the market is beginning to doubt the sustainability of the current growth trajectory.

Equity Rotations as a Proxy for Duration
If the yield curve represents the bond market’s view of interest rate duration, equity rotations serve as the stock market’s equivalent. Stocks are, fundamentally, claims on future cash flows. Because those cash flows are discounted back to the present, stocks carry "duration" just as bonds do.
Growth companies, which rely on earnings far into the future, have high duration. Value companies, which generate immediate, reliable cash flows, have low duration. When interest rates rise, the "discount rate" applied to these future cash flows increases, disproportionately hammering the valuations of growth stocks compared to value stocks.
A shift from growth-heavy portfolios to value-tilted ones is not merely a preference for one sector over another; it is a fundamental repricing of risk based on the cost of money. When we observe violent, rapid rotations between these two styles, it is a signal that the market is struggling to anchor its expectations.
The Volatility of Regime Uncertainty
During the expansionary phase of a business cycle, the macro environment is typically stable. Investors have high conviction, and market leadership remains consistent. However, as the cycle matures, this stability fractures.
Investors begin to grapple with fundamental questions:
- Will inflation remain persistent or transitory?
- Is the central bank over-tightening into a slowing economy?
- Can corporate margins withstand the rising cost of debt?
When the market cannot answer these questions with confidence, we see the "whipsaw" effect—volatile rotations where leadership changes on a weekly or even daily basis. This volatility is a proxy for regime uncertainty. The market is effectively telling us that it senses the underlying economic conditions are shifting, but it lacks the conviction to commit to a new direction.

The Distinction Between Condition and Timing
The most significant error in modern financial analysis is the failure to distinguish between a condition indicator and a timing indicator.
A condition indicator provides a snapshot of the current environment. It tells us that the atmosphere is conducive to a storm. A falling barometer is a classic condition indicator; it informs us that atmospheric pressure is dropping, which historically correlates with inclement weather.
A timing indicator, by contrast, would tell us exactly what time the storm will arrive.
Yield curves and style rotations are high-fidelity condition indicators. They tell us that the "atmospheric pressure" of the economy is changing. However, they are poor timing indicators. Just as a barometer does not dictate the arrival of a hurricane, a flattened yield curve does not mandate an immediate recession. Ignoring this distinction leads to the "false signal" trap, where investors sell out of the market prematurely, missing the final, often profitable, leg of an economic cycle.
External Distortions and Noise
We must also account for the "noise" that can distort these signals. In the post-2008 era, central bank interventions such as Quantitative Easing (QE) and Quantitative Tightening (QT) have fundamentally altered the mechanics of the bond market.
When the Federal Reserve engages in massive bond-buying programs, they artificially suppress yields, flattening the curve in ways that have nothing to do with the business cycle. Similarly, the rise of passive, index-based investment strategies has accelerated momentum-chasing behavior. When millions of dollars are automatically allocated into the top-performing stocks of the month, equity rotations become exaggerated, potentially creating the appearance of a market top where none exists.

Implications for Portfolio Management
So, how should an investor navigate a period characterized by these signals?
First, abandon the quest for the "perfect" market-timing model. Instead, treat these indicators as a call to increase risk management rigor. When the yield curve flattens and equity rotations become volatile, the prudent response is not to exit the market entirely, but to adjust the defensive architecture of your portfolio.
- Stricter Stop-Loss Levels: In a regime characterized by uncertainty, protecting capital becomes paramount. Tightening stop-loss orders helps mitigate the damage of sudden, volatility-driven drawdowns.
- Focus on Technical Analysis: When fundamental signals are muddied by central bank distortion, price action and market structure often provide a clearer picture of investor sentiment and liquidity trends.
- Frequent Risk Assessment: Move away from quarterly or annual reviews. In a late-cycle environment, the "regime" can change in a matter of weeks. Stress-testing portfolios against varying interest rate and inflation scenarios is essential.
- Adopt a Tactical Mindset: Recognize that the market may remain "irrational" longer than a bearish indicator can remain "rational." As long as the data suggests that the economy is still expanding—even if late-cycle—it is vital to participate in the upside while maintaining a hedge against the inevitable, yet ill-timed, correction.
Conclusion: Preparing for the Widening Horizon
The yield curve and equity rotations remain two of the most informative tools in the financial analyst’s kit. They are not, however, oracle-like predictions of an imminent crash. They are indicators of a shifting environment—a "yellow light" that requires caution rather than a "red light" that mandates a full stop.
By accepting that we are likely in a late-cycle phase characterized by regime uncertainty, investors can stop looking for a precise date for the next recession and start preparing for a wider range of potential outcomes. The goal is not to predict the exact moment the cycle ends, but to build a portfolio robust enough to survive the transition, whenever it may arrive. The market may be sending a warning, but it is up to the investor to determine how to heed that warning without surrendering the opportunity for continued growth.
 Raul Delapena Setiawan
  Dwi Wanna
  Lina Irawan