
 By Dwi Wanna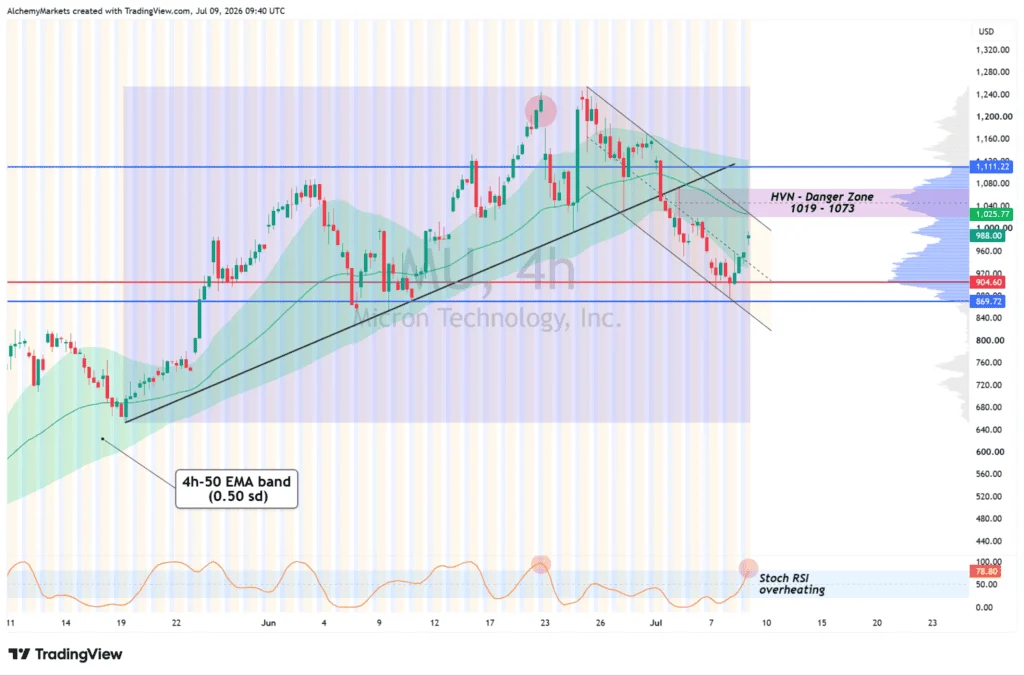
Global financial markets have found themselves at a critical juncture, caught in a high-stakes tug-of-war between restrictive macroeconomic policy and resilient corporate fundamentals. Investors have been forced to navigate a challenging dual narrative: the Federal Reserve’s cautious approach to monetary easing and a sudden escalation in geopolitical tensions.
While these macroeconomic headwinds initially sparked a sell-off across risk assets, driving bond yields and crude oil prices higher, a resilient undercurrent has emerged. The artificial intelligence (AI) and semiconductor sectors, which bore the brunt of the initial risk-off impulse, have mounted a technical recovery. This rebound raises a pivotal question for market participants: Is this the beginning of a sustained bullish reversal, or merely a temporary relief rally in a market still dominated by macro anxiety?
Main Facts: The Dual Headwinds Confronting Global Markets
The recent market volatility can be traced back to two distinct catalyst categories that hit trading desks simultaneously:
1. The Federal Reserve’s Unhurried Stance
The release of the Federal Reserve’s latest meeting minutes confirmed what many institutional investors had already begun to suspect: the central bank is in no hurry to aggressively cut interest rates. The minutes revealed a consensus among policymakers that while inflation is moderating, it remains above the Fed’s 2% target, necessitating a "higher-for-longer" or at least a highly cautious, data-dependent approach to future rate cuts. Because this hawkish undertone had been partially priced into the fixed-income markets over the preceding weeks, the direct impact of the release was somewhat muted. However, it effectively removed any lingering expectations of aggressive near-term monetary stimulus, cementing a high-yield environment that naturally compresses equity valuation multiples.
2. Escalating Geopolitical Risks
A more disruptive shock arrived in the form of renewed geopolitical hostilities. Escalating conflict headlines immediately triggered a classic risk-off flight to safety. Crude oil prices spiked on supply disruption fears, while government bond yields surged as investors recalibrated their inflation expectations upward. The spike in front-end yields—specifically the U.S. 2-Year Treasury yield—placed immediate pressure on high-duration growth assets, most notably the Nasdaq 100 and mega-cap technology equities.
Despite these overlapping pressures, the technology sector, particularly companies tied to the AI infrastructure buildout, demonstrated notable intraday resilience. This suggests that while macro risks are actively being digested, the structural demand for AI hardware remains a powerful counterweight to geopolitical and interest-rate anxieties.
Chronology of the Market’s Response
Understanding the sequence of events is crucial to evaluating whether the current market bounce has structural longevity.
[ Early Session ] ────────────────► [ Mid-Session ] ────────────────► [ Late Session ]
Geopolitical headlines break;       Fixed-income markets stabilize;   Buyers step in at key support;
Safe-haven assets surge.            Crude oil prices plateau.         Tech and AI sectors rebound.
Risk assets experience sell-off. Selling pressure slows down. Relief bounce established.- The Initial Shock (Early Session): The trading day opened under intense pressure as geopolitical headlines crossed the wires. Safe-haven assets saw immediate inflows. Concurrently, the U.S. 2-Year Treasury yield marched upward, compounding the pressure on tech stock valuations. Equity futures tumbled, with the tech-heavy Nasdaq leading the decline.
- The Stabilization Phase (Mid-Session): As the session progressed, the selling pressure began to exhaust itself. Fixed-income markets stabilized, and crude oil prices plateaued. Investors began to differentiate between macro-driven asset liquidations and the underlying health of corporate balance sheets.
- The Technical Rebound (Late Session): Buyers stepped in at key technical support levels. The Nasdaq began to claw back its losses, driven by a recovery in mega-cap semiconductor and hardware names. By the closing bell, what had started as a deep risk-off rout transformed into a conditional relief bounce, leaving key indexes resting on critical technical pivots.
Supporting Data: Technical Analysis of Key Market Indicators
To determine if this recovery is sustainable, analysts are looking closely at key cross-asset ratios, regional indexes, and individual stock volume profiles.

Nasdaq/US 2-Year Yield Ratio (USTEC/US02Y)
A highly effective tool for measuring equity market resilience against interest rate pressure is the ratio between the Nasdaq 100 (USTEC) and the U.S. 2-Year Treasury Yield (US02Y). This ratio illustrates whether tech stocks are gaining strength relative to the headwinds imposed by front-end bond yields.
On the 4-hour (4H) timeframe, the USTEC/US02Y ratio is currently range-bound.
  Ratio Level
    ▲
    │      [Upper Range Limit]
    │         /      /
    │  ──────/──────/─────────  <-- 100 EMA Band (Resistance/Pivot Zone)
    │       /      /
    │  ────/───────V───────────  <-- Midline (approx. 7,200)
    │     /
    │  ──/─────────────────────  <-- Lower Range Limit (Support)
└─────────────────────────────► Time- The Support Bounce: The ratio successfully defended the lower boundary of its recent trading range, signaling that buyers are willing to step in when valuations become relatively attractive, even in a high-yield environment.
- The 100 EMA Barrier: The ratio is currently testing the 100 Exponential Moving Average (EMA) band. This technical indicator serves as a crucial line of demarcation.
- The Road Ahead: A decisive push above the range midline near 7,200 would indicate that the AI-driven tech rally is successfully decoupling from and overpowering interest rate pressures. Conversely, a rejection at this level would suggest that elevated yields continue to cap the market’s upside potential, keeping equities locked in a consolidated, defensively oriented regime.
Asian Semiconductor Sentiment: The KOSPI Index
Because the AI hardware supply chain is global, U.S. markets cannot be analyzed in a vacuum. South Korea’s KOSPI Index serves as an essential barometer for global hardware sentiment, given that it houses memory giants Samsung Electronics and SK Hynix.
KOSPI 4-Hour Chart Analysis:
┌────────────────────────────────────────────────────────┐
│                                                        │
│  [50 EMA Band] ───────────────────────────────         │
│                                                        │
│  [Price Action] ───► Currently Suppressed Below 50 EMA │
│                      (Indicates cautious buyers)       │
│                                                        │
└────────────────────────────────────────────────────────┘
While early optimism surrounding Korean chipmakers briefly lifted regional markets, that enthusiasm has since moderated. The KOSPI 4-hour chart shows price action remaining suppressed below its 50 EMA band.
This technical posture does not imply an imminent bearish collapse, but it does signal that institutional buyers in Asian markets have not yet fully regained control. For the global AI hardware recovery to be deemed credible and synchronized, the KOSPI must break back above this 50 EMA band, confirming that global semiconductor demand is robust enough to override localized macroeconomic concerns.
Micron Technology (NASDAQ: MU) and Volume Profile Dynamics
On an individual stock level, memory manufacturer Micron Technology (NASDAQ: MU) provides a clear case study of this conditional relief bounce. Micron’s stock experienced a sharp rebound from its recent lows, but the recovery is now entering a heavy resistance zone.
Using Volume Profile analysis, market analysts can identify where the highest concentration of trading activity occurred historically:
- High-Volume Node Resistance: Micron’s price is currently advancing into a major high-volume node, representing a price level where a significant number of shares previously changed hands.
- Seller Defense vs. Buyer Absorption: If institutional sellers defend this zone, Micron’s recent upward move will likely be categorized as a technical retest of broken support rather than a genuine bullish breakout. To confirm a structural recovery, buyers must absorb this overhead supply and push the price cleanly above this high-volume cluster on expanding volume.
Official Responses and Institutional Perspectives
The current market environment has drawn extensive commentary from policymakers, central bank officials, and Wall Street strategists, all attempting to parse the crosscurrents of inflation, geopolitics, and technology spending.

Central Bank Caution
In recent public appearances, Federal Reserve officials have maintained a unified, conservative message regarding the path of interest rates. Federal Reserve Governor Christopher Waller recently emphasized the need for caution, stating:
"There is no rush to push interest rates down rapidly. The economy is performing well, the labor market remains resilient, and we must ensure inflation returns to our 2% target sustainably before easing policy too quickly."
This sentiment was echoed in the latest FOMC minutes, reinforcing the view that the "Fed put"—the historical tendency of the central bank to rescue markets with rate cuts during times of turmoil—is currently constrained by inflation dynamics.
Wall Street Analyst Outlook
In contrast to the Fed’s caution, equity strategists remain highly constructive on the structural earnings power of the technology sector, particularly AI infrastructure. In a recent note to clients, Goldman Sachs’ Chief Equity Strategist remarked:
"While macro headlines and yield volatility are creating short-term noise, the micro foundations of the technology sector remain incredibly robust. We are not seeing companies scale back their capital expenditure guidance for AI infrastructure. On the contrary, hyperscalers continue to signal aggressive spending. This fundamental strength suggests that the downside for premium semiconductor names remains well-supported."
Similarly, market analysts at Morgan Stanley pointed out that the recent correction in semiconductor stocks was driven entirely by multiple compression from rising yields, rather than any deterioration in corporate earnings quality or demand trends.
Strategic Implications for Investors
The combination of technical indicators, macroeconomic constraints, and corporate resilience points to several key implications for global investors as they position their portfolios for the remainder of the quarter.
1. A Relief Bounce with Strict Conditions
The current market recovery should be treated as a conditional relief bounce rather than a confirmed trend reversal. For a sustainable uptrend to establish itself, key technical levels must be reclaimed.

Specifically, investors should monitor whether the USTEC/US02Y ratio can break above the 7,200 midline and whether the KOSPI can reclaim its 4H 50 EMA. Until these confirmations occur, the market remains vulnerable to sudden pullbacks if macroeconomic or geopolitical headlines take a turn for the worse.
2. The Unbroken Secular AI Thesis
From a fundamental perspective, the core bull case for the artificial intelligence sector remains fully intact. The recent downward pressure on stocks like Micron, Samsung, and other semiconductor leaders was not caused by fundamental execution failures, downward revisions in corporate guidance, or cancelled capital expenditure plans.
Instead, it was a macro-driven valuation adjustment. If geopolitical tensions in key energy-producing regions begin to cool, oil prices stabilize, and Treasury yields retreat, the companies with the strongest secular growth drivers—namely those at the forefront of the AI hardware supply chain—are poised to recover the fastest and lead the next leg of the market’s advance.
3. Tactical Asset Allocation and Risk Management
For tactical investors, the current market regime demands strict risk discipline. Buying the dip in high-quality technology assets remains a viable long-term strategy, but position sizing must account for elevated bond market volatility (reflected in the MOVE index) and geopolitical uncertainty.
Investors may consider utilizing options overlay strategies, such as covered calls or protective puts, to navigate this range-bound, headline-driven environment. Additionally, maintaining a diversified allocation that pairs secular growth assets with defensive, yield-generating instruments can help cushion portfolios against sudden shifts in macroeconomic sentiment.
 Basiran
  Siti Muinah
  Muslim