
 By Nana Wu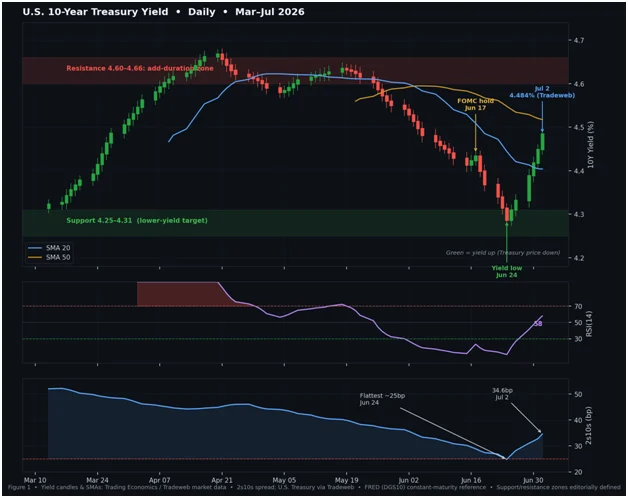
In the complex architecture of global finance, few indicators carry as much weight as the U.S. 10-year Treasury yield. As of the market close on Thursday, July 2, 2026, the benchmark yield was quoted at 4.484% by Tradeweb. This figure serves as a snapshot of a market caught in a state of prolonged indecision—a "boxed-in" environment where the Federal Reserve’s hawkish rhetoric clashes with increasingly fragile economic data.
For institutional investors and fixed-income traders, the current environment is defined by the absence of a clear directional catalyst. While the market continues to price in the possibility of further rate hikes, the underlying economic reality—characterized by softening labor markets and persistent inflation—suggests that the Federal Reserve is unlikely to break from its current holding pattern in the immediate future. This disconnect creates a tactical opportunity: a disciplined strategy of buying Treasury price weakness (selling yields) at the upper end of the established range and reducing exposure during bouts of price strength (buying yields) at the lower end.
The Macroeconomic Setup: A Landscape of Uncertainty
The central narrative driving current bond market dynamics is the tension between "hike risk" and "growth fatigue." Fed funds futures, as tracked by CME, show a 54.8% probability of a September hike, a decline from 64.3% just over a week ago. This cooling in hike expectations follows a June payroll report that signaled significant deceleration in the U.S. labor market.
The June jobs data revealed a gain of only 57,000 positions, falling well short of the 110,000 consensus estimate. Furthermore, the downward revisions to April and May, totaling a combined 74,000 jobs, have forced a re-evaluation of the labor market’s resilience. With the unemployment rate ticking up to 4.2% and labor participation contracting from 61.8% to 61.5%, the narrative of an "overheating" economy is rapidly losing its foundation.
Despite this, the Fed remains in a state of cautious observation. Core PCE inflation in May printed at 3.4%—the highest level since October 2023—providing the central bank with enough justification to keep rates in the 3.50%–3.75% range. For the bond market, this creates a "wait and see" deadlock that keeps the 10-year Treasury trapped within a technical band of 4.25% to 4.66%.
A Chronology of the Current Compression
The current market cycle is the result of a multi-month progression of shifting sentiment.
- Spring 2026: The market faced an "energy-driven inflation scare," which pushed the 10-year yield toward the upper resistance band of 4.60%–4.66%. During this period, the expectation was that the Fed would be forced to embark on a more aggressive tightening cycle to curb supply-side price pressures.
- Late June 2026: As energy prices stabilized and economic data began to show signs of structural weakening, the market pivoted. By June 24, the 10-year yield had compressed to approximately 4.28%. This movement coincided with the flattest reading on the two-year to 10-year yield spread, suggesting that the market was beginning to price in the end of the hiking cycle.
- Early July 2026: Following the June payrolls report, the market entered a period of orderly recovery. Yields climbed back toward the 4.48% level, yet they stopped short of testing the spring highs. This behavior indicates that while the market is willing to "fade" the extreme optimism of a pivot, it lacks the conviction to push yields back into breakout territory.
Supporting Data: Technical Indicators and Curve Dynamics
The technical configuration of the bond market reinforces the "range-bound" thesis. The Relative Strength Index (RSI) for the 10-year yield is hovering near 58, a mid-range reading that confirms the recovery from the June 24 oversold condition without indicating an overbought extreme.
Perhaps more telling is the relationship between the 20-day and 50-day Simple Moving Averages (SMA). The 20-day SMA remains below the 50-day SMA, indicating that while the recent rebound is firm, the market is still working through the momentum decay caused by the earlier compression.

The two-to-10-year spread, currently at +34.6 basis points, serves as the pulse of this market. While the spread widened from the 25-basis-point floor seen on June 24, this tactical steepening is viewed by analysts at TD Securities as a corrective move rather than a trend reversal. The structural bias remains toward flattening, as the "hike risk" embedded in the front end of the curve continues to act as a weight, while long-end yields are capped by long-term growth concerns.
Official Perspectives: The Fed’s Balancing Act
The Federal Reserve’s communication strategy remains intentionally ambiguous. At the ECB Forum this week, Fed Chair Kevin Warsh acknowledged that inflation risks have "eased over the past month." This admission was a critical dovish signal, yet it was carefully tempered by a staunch reaffirmation of the Fed’s commitment to the 2% inflation target.
This dual-track messaging is designed to prevent financial conditions from loosening too quickly. By maintaining a high "hike probability" in the markets, the Fed effectively uses the bond market as a tool for monetary policy, keeping borrowing costs elevated without having to actively raise the federal funds rate. However, as the data—specifically payrolls—continues to soften, the credibility of this "higher for longer" posture is being tested. The market is increasingly betting that the Fed’s commitment to the 2% target will eventually be superseded by the need to prevent a sharper labor market downturn.
Tactical Implications: The Case for Duration
For investors, the current environment demands discipline. The "duration entry" strategy advocated by many desk strategists centers on buying into yield spikes.
The Asymmetry of the Setup
The risk-reward profile is skewed in favor of the duration buyer.
- The Upside Risk (Yield Spikes): If yields rise toward 4.60%–4.66%, Treasury prices sit at their range lows. This is the "cleaner entry" point. Should the Fed maintain its hold, the market will eventually be forced to unwind its "hike risk" premium, causing yields to fall and Treasury prices to appreciate.
- The Downside Risk (Yield Drops): If yields approach the 4.25%–4.31% support zone, Treasury prices are effectively at their range highs. Chasing duration at these levels is inefficient, as the potential for further price appreciation is limited by the reality of the 2% inflation target.
Scenario Analysis
- The Hawkish Surprise: A resurgence in inflation prints or a pivot in Fed rhetoric emphasizing the 2% target over growth would likely push yields through the 4.66% resistance level. In this scenario, the "range-bound" thesis is invalidated, and investors must shift toward defensive positioning.
- The Base Case: The Fed holds, and data remains mixed. The yield continues to oscillate between 4.25% and 4.66%. This is the environment for "range-trading"—adding duration at 4.60% and trimming at 4.30%.
- The Dovish Pivot: Continued labor weakness or a cooling CPI report will likely break the lower bound of 4.25%. This would signal that the market is finally pricing in an easing cycle, leading to a meaningful rally in long-dated Treasuries.
Conclusion: The Discipline of the Range
The path forward for the 10-year Treasury is currently dictated by a tug-of-war between stagnant growth and entrenched inflation. Until a clear catalyst—either a significant break below 4.25% or a sustained move above 4.66%—emerges, the market will likely remain in its current, albeit frustrating, equilibrium.
For the active manager, the message is clear: do not fight the range. Accumulate duration when the market fears a hike that the data does not support, and reduce exposure when the market becomes overly optimistic about an easing cycle that the Fed is not yet ready to deliver. In this, the "cleanest" trade is not found in predicting the next move, but in positioning for the inevitable reversion to the center of the current volatility band.
Disclaimer: This article is for informational purposes only and does not constitute investment advice, a recommendation, or an offer to buy or sell any security. Treasury yields, spreads, and policy expectations are subject to continuous change. Investors should conduct their own independent research and consult with a licensed financial professional before executing any trading strategy. All market data cited reflects the U.S. market close on Thursday, July 2, 2026.
 Raul Delapena Setiawan
  Muslim
  rifanmuazin