
 By Nana Wu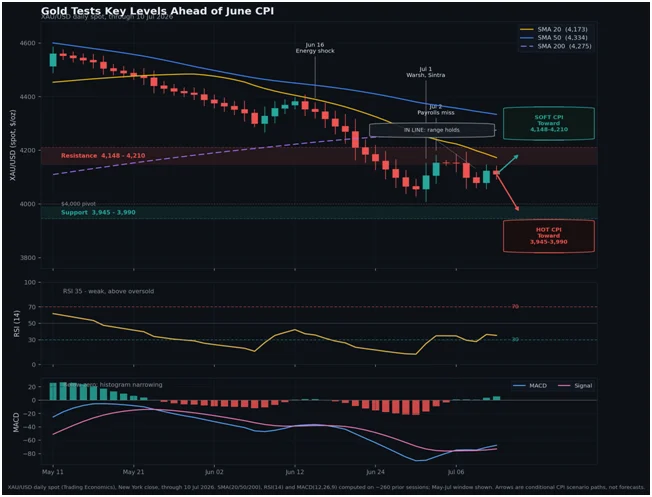
As of July 10, 2026, the gold market finds itself in a state of precarious equilibrium. With spot prices hovering near $4,111 per ounce, the precious metal is trading below its key short-term moving averages, reflecting a broader market sentiment characterized by caution and strategic positioning. Investors are currently tethered to a singular, high-impact event: the release of the June Consumer Price Index (CPI), scheduled for Tuesday, July 14, at 8:30 a.m. ET.
This report serves as the final major inflation pulse before the Federal Open Market Committee (FOMC) convenes on July 28–29. While a “hold” remains the market’s base case for the July meeting, the underlying data within the June CPI print will likely dictate whether gold experiences a retest of the $4,000 psychological floor or a recovery toward the $4,200 resistance level.
The Chronology of Decision-Making
The current macroeconomic landscape is defined by a rigid timeline. The Federal Reserve, under the leadership of Chair Kevin Warsh, has moved away from aggressive forward guidance, preferring instead to navigate policy based on incoming data.
- July 14: June CPI release. This is the critical juncture for near-term volatility.
- July 28–29: FOMC meeting. Current market pricing via CME FedWatch suggests a 74.9% probability of a policy hold, effectively discounting a rate hike for this month.
- September 15–16: FOMC meeting. This gathering is increasingly viewed as the true battleground for policy shift. With approximately 63% of market pricing currently factoring in a potential 25 basis-point hike by September, the June CPI report will act as the primary catalyst for recalibrating these expectations.
Supporting Data: Parsing the Inflation Mix
The composition of the upcoming inflation data is as critical as the headline number itself. In May, the economy witnessed a divergence: headline inflation rose 0.5% month-over-month (4.2% year-over-year), while core inflation—which excludes volatile energy and food components—remained more tempered at 0.2% month-over-month (2.9% year-over-year).
Continuum Economics suggests that June may offer a reprieve on the headline front, driven by a late-month correction in energy prices. The forecast projects headline CPI to be roughly flat (0.0%) for the month, with the year-over-year rate cooling to approximately 3.9%. However, the “sticky” nature of services and shelter inflation means that core CPI is expected to rise by 0.3% month-over-month.
This nuance is vital for gold. Because gold is a non-yielding asset, its value is inversely correlated with the opportunity cost of holding it, which is measured by real interest rates. If the headline CPI cools due to energy, but core services remain elevated, the Federal Reserve may feel compelled to maintain a hawkish stance to prevent inflation from becoming entrenched, thereby keeping downward pressure on gold.
Market-Implied Realities and Yield Dynamics
The current interest rate environment is the primary headwind for bullion. As of July 10, the 2-year Treasury yield stands at 4.19%, while the 10-year yield sits at 4.54%. More importantly, the 10-year TIPS real yield—the benchmark for the opportunity cost of gold—is holding near 2.30%.
These figures represent a formidable obstacle for gold bulls. When real yields rise, the cost of holding gold increases, as investors can capture higher risk-free returns in the bond market. Furthermore, the US Dollar Index (DXY), currently hovering near 100.9, has benefited from safe-haven demand stemming from ongoing geopolitical tensions in the Middle East. A stronger dollar makes gold more expensive for international buyers, further suppressing demand at the margin.
Official Responses and Fed Philosophy
At the European Central Bank’s Sintra forum on July 1, Chair Kevin Warsh reinforced the Fed’s commitment to the 2% inflation objective. While he acknowledged that lower oil prices have helped dampen inflation expectations, he pointedly declined to provide specific guidance for the July meeting.
This silence is deliberate. By refusing to pre-commit, the Fed retains maximum flexibility to respond to incoming labor and inflation data. For the market, this means that every single data point—including the June CPI—is being hyper-analyzed for "hawkish" or "dovish" signals. The consensus among policymakers is that while the economy has shown resilience, the fight against inflation is not yet won. This rhetoric provides the "higher for longer" narrative that has kept gold trapped in its current range.

Implications for Gold: Three Scenarios
The market’s reaction to the CPI data will likely follow one of three distinct paths, each carrying specific implications for gold’s technical trajectory.
1. The "Hot, Broad" Scenario
If both headline and core inflation print significantly above expectations, it would signal that inflationary pressures have spread beyond energy and into the core services sector. This would likely trigger a surge in Treasury yields and the dollar, potentially forcing gold to test support in the $3,945–$3,990 range.
2. The "Near Baseline" Scenario
If the data aligns with expectations, the market is likely to remain in a state of limbo. Gold would likely continue its range-bound behavior, trading between $4,000 and $4,150. In this scenario, the market would maintain the status quo for the July FOMC meeting while waiting for the subsequent July and August inflation prints to provide more clarity for the September decision.
3. The "Soft, Broad" Scenario
A surprise to the downside in both headline and core figures would be the most bullish outcome for gold. A significant cooling of shelter and services inflation would reduce the urgency for a September hike, leading to a decline in real yields and the dollar. This would provide the necessary tailwinds for gold to break above its current overhead resistance and push toward the $4,148–$4,210 zone.
The Technical Outlook
From a technical perspective, gold’s momentum is currently fragile. With a 14-day Relative Strength Index (RSI) near 35, the metal is not yet deeply oversold, but it is clearly lacking upward momentum. The overhead resistance provided by the 200-day moving average, currently near $4,275, looms large.
The MACD histogram, however, shows that the intensity of selling pressure is beginning to wane. This suggests that while the trend remains vulnerable to hawkish surprises, the market is currently in a "wait-and-see" mode rather than a full-scale liquidation. Investors should treat the identified support and resistance bands as reaction zones. In a volatile macro environment, high-impact data releases often result in "gapping" through technical levels, making risk management paramount.
Conclusion: The Path Ahead
The June CPI report is a critical piece of the puzzle, but it is not the final word. The Federal Reserve will have the benefit of two additional CPI reports and two employment readings before the September meeting. While the market’s base case for a July hold is unlikely to be overturned by a single data point, the June CPI will serve as the opening salvo in the debate over the September rate trajectory.
For gold investors, the message is clear: watch the split between headline and core data. If the headline cools while core remains sticky, the Federal Reserve’s hawkish leanings will likely persist, keeping gold under pressure. Only a broad-based cooling of inflation will provide the catalyst required for a sustained breakout. Until then, gold remains a prisoner of the opportunity cost, waiting for the macroeconomic environment to tilt in its favor.
Disclaimer: This report is for informational purposes only and does not constitute financial or investment advice. Market data, including yields and probabilities, are subject to rapid change. Investors are encouraged to conduct their own due diligence and consult with a certified financial advisor before making any investment decisions based on these projections.
 Evan Lee Salim
  Laily UPN
  Asep Darmawan